Scale
Edit this pageScales are functions that transform a domain of data values (numbers, dates, strings, etc.) to a range of visual values (pixels, colors, sizes). Internally, Vega-Lite uses Vega scales, which are derived from the d3-scale library. For more background about scales, please see “Introducing d3-scale” by Mike Bostock.
Vega-Lite automatically creates scales for fields that are mapped to position and mark property channels.
To customize the scale of a field, users can provide a scale object as a part of the field definition to customize scale properties (e.g., type, domain, and range).
// Single View Specification
{
  "data": ... ,
  "mark": ... ,
  "encoding": {
    "x": {
      "field": ...,
      "type": ...,
      "scale": {                // scale
        "type": ...,
        ...
      },
      ...
    },
    "y": ...,
    ...
  },
  ...
}
Besides the scale property of each encoding channel, the top-level configuration object (config) also provides scale config (config: {scale: {...}}) for setting default scale properties for all scales.
For more information about guides that visualize the scales, please see the axes and legends pages.
Documentation Overview
- Scale Types
- Scale Domains
- Scale Ranges
- Continuous Scales
- Discrete Scales
- Discretizing Scales
- Disabling Scale
- Configuration
Scale Types
The type property can be specified to customize the scale type.
| Property | Type | Description |
|---|---|---|
| type | String |
The type of scale. Vega-Lite supports the following categories of scale types: 1) Continuous Scales – mapping continuous domains to continuous output ranges ( 2) Discrete Scales – mapping discrete domains to discrete ( 3) Discretizing Scales – mapping continuous domains to discrete output ranges ( Default value: please see the scale type table. |
By default, Vega-Lite use the following scale types for the following data types and encoding channels:
| Nominal / Ordinal | Quantitative | Bin-Quantitative1 | Temporal | |
|---|---|---|---|---|
| X, Y | Band / Point2 | Linear | Linear 3 | Time |
| Size, Opacity | Point | Linear | Bin-Linear | Time |
| Color | Ordinal | Sequential | Bin-Ordinal | Sequential |
| Shape | Ordinal | N/A | N/A | N/A |
1 Quantitative fields with the bin transform.
2 For positional (x and y) ordinal and ordinal fields, "point" is the default scale type for all marks except
bar and rect marks, which use "band" scales.
3 For static plots, both "linear" and "bin-linear" work with binned fields on x and y. However, panning and zooming do not work with discretized scales such as "bin-linear", thus we use "linear" as the default scale type for binned fields on x and y.
Scale Domains
By default, a scale in Vega-Lite draws domain values directly from a channel’s encoded field. Users can specify the domain property of a scale to customize its domain values. To sort the order of the domain of the encoded, the sort property of a field definition can be specified.
| Property | Type | Description |
|---|---|---|
| domain | Number[] | String[] | Boolean[] | DateTime[] | String | SelectionDomain |
Customized domain values. For quantitative fields, For temporal fields, For ordinal and nominal fields, The |
A common use case for the domain property is to limit, for example, the x range of values to include in a plot. However, setting the domain property alone is insufficient to achieve the desired effect. For example, consider the line plot specification below in which the x domain is restricted to the range [300, 450].
There are two approaches to keep the mark from being plotted outside the desired x range of values.
- The first one is to set
clip: truein mark definition.
- The second approach is to use
transform. Note that these two approaches have slightly different behaviors. Usingtransformremoves unwanted data points, yet settingcliptotrueclips the mark to be the enclosing group’s width and height.
Scale Ranges
The range of the scale represents the set of output visual values. Vega-Lite automatically determines the default range for each encoding channel using the following rules:
| Channels | Default Range |
|---|---|
x |
The range is always [0, width]. Any directly specified range will be ignored. Range can be customized via the view’s width property or via range steps and paddings properties for band and point scales. |
y |
The range is always [0, height]. Any directly specified range will be ignored. Range can be customized via the view’s height property or via range steps and paddings properties for band and point scales. |
opacity |
Derived from the scale config’s min/maxOpacity. |
color |
Derived from the following named ranges based on the field’s type: • "category" for nominal fields. • "ordinal" for ordinal fields. • "heatmap" for quantitative and temporal fields with "rect" marks and "ramp' for other marks. See the color scheme section for examples. |
size |
Derived from the following named ranges based on the mark type: • min/maxBandSize for bar and tick. • min/maxStrokeWidth for line and rule. • min/maxSize for point, square, and circle • min/maxFontSize for text |
shape |
Derived from the pre-defined named range "symbol". |
To customize range values, users can directly specify range, or the special range properties: rangeStep and padding for band and point scales and scheme for ordinal and sequential color scales.
| Property | Type | Description |
|---|---|---|
| range | Number[] | String[] | String |
The range of the scale. One of:
Notes: 1) For sequential, ordinal, and discretizing color scales, you can also specify a color 2) Any directly specified |
Color Schemes
Color schemes provide a set of named color palettes as a scale range for the color channel. Vega-Lite (via Vega) provides a collection of perceptually-motivated color schemes, many of which are drawn from the d3-scale, d3-scale-chromatic, and ColorBrewer projects.
By default, Vega-Lite assigns different default color schemes based on the types of the encoded fields:
- Nominal fields use the
"categorical"pre-defined named range (the"tableau10"scheme by default).
- Ordinal fields use the
"ordinal"pre-defined named color range (the"blues"color scheme by default).
- Quantitative and temporal fields use the pre-defined named color range
"heatmap"(the"viridis"scheme by default) for rect marks and"ramp"(the"blues"scheme by default) for other marks.
There are multiple ways to customize the scale range for the color encoding channel:
1) Set a custom scheme.
| Property | Type | Description |
|---|---|---|
| scheme | String | SchemeParams |
A string indicating a color scheme name (e.g., Discrete color schemes may be used with discrete or discretizing scales. Continuous color schemes are intended for use with sequential scales. For the full list of supported schemes, please refer to the Vega Scheme reference. |
For example, the following plot use the "category20b" scheme.
The scheme property can also be a scheme parameter object, which contain the following properties:
| Property | Type | Description |
|---|---|---|
| name | String |
Required. A color scheme name for sequential/ordinal scales (e.g., For the full list of supported schemes, please refer to the Vega Scheme reference. |
| extent | Number[] |
For sequential and diverging schemes only, determines the extent of the color range to use. For example |
2) Setting the range property to an array of valid CSS color strings.
3) Change the default color schemes using the range config.
Continuous Scales
Continuous scales map a continuous domain (numbers or dates) to a continuous output range (pixel locations, sizes, colors). Supported continuous scale types for quantitative fields are "linear", "log", "pow", "sqrt", and "sequential". Meanwhile, supported continuous scale types for temporal fields are "time", "utc", and "sequential".
By default, Vega-Lite uses "linear" scales for quantitative fields and uses "time" scales for temporal fields for all encoding channels except for color, which uses "sequential" scales for both quantitative and temporal fields.
In addition to type, domain, and range, continuous scales support the following properties:
| Property | Type | Description |
|---|---|---|
| clamp | Boolean |
If Default value: derived from the scale config’s |
| interpolate | ScaleInterpolate | ScaleInterpolateParams |
The interpolation method for range values. By default, a general interpolator for numbers, dates, strings and colors (in RGB space) is used. For color ranges, this property allows interpolation in alternative color spaces. Legal values include Note: Sequential scales do not support |
| nice | Boolean | Number | String | Object |
Extending the domain so that it starts and ends on nice round values. This method typically modifies the scale’s domain, and may only extend the bounds to the nearest round value. Nicing is useful if the domain is computed from data and may be irregular. For example, for a domain of [0.201479…, 0.996679…], a nice domain might be [0.2, 1.0]. For quantitative scales such as linear, For temporal fields with time and utc scales, the Default value: |
| padding | Number |
For continuous scales, expands the scale domain to accommodate the specified number of pixels on each of the scale range. The scale range must represent pixels for this parameter to function as intended. Padding adjustment is performed prior to all other adjustments, including the effects of the zero, nice, domainMin, and domainMax properties. For band scales, shortcut for setting For point scales, alias for Default value: For continuous scales, derived from the scale config’s |
| round | Boolean |
If Default value: |
| zero | Boolean |
If Default value: Note: Log, time, and utc scales do not support |
Linear Scales
Linear scales ("linear") are quantitative scales scales that preserve proportional differences. Each range value y can be expressed as a linear function of the domain value x: y = mx + b.
Power Scales
Power scales ("pow") are quantitative scales scales that apply an exponential transform to the input domain value before the output range value is computed. Each range value y can be expressed as a polynomial function of the domain value x: y = mx^k + b, where k is the exponent value. Power scales also support negative domain values, in which case the input value and the resulting output value are multiplied by -1.
| Property | Type | Description |
|---|---|---|
| exponent | Number |
The exponent of the |
Square Root Scales
Square root ("sqrt") scales are a convenient shorthand for power scales with an exponent of 0.5, indicating a square root transform.
Logarithmic Scales
Log scales ("log") are quantitative scales in which a logarithmic transform is applied to the input domain value before the output range value is computed. Log scales are particularly useful for plotting data that varies over multiple orders of magnitude. The mapping to the range value y can be expressed as a logarithmic function of the domain value x: y = m loga(x) + b, where a is the logarithmic base.
As log(0) = -∞, a log scale domain must be strictly-positive or strictly-negative; the domain must not include or cross zero. A log scale with a positive domain has a well-defined behavior for positive values, and a log scale with a negative domain has a well-defined behavior for negative values. (For a negative domain, input and output values are implicitly multiplied by -1.) The behavior of the scale is undefined if you run a negative value through a log scale with a positive domain or vice versa.
| Property | Type | Description |
|---|---|---|
| base | Number |
The logarithm base of the |
Example: The following plot has a logarithmic y-scale.
Time and UTC Scales
Time and UTC scales ("time" and "utc") are continuous scales with a temporal domain: values in the input domain are assumed to be Date objects or timestamps. Time scales use the current local timezone setting. UTC scales instead use Coordinated Universal Time.
Sequential Scales
Sequential scales ("sequential") are similar to linear scales, but use a fixed interpolator to determine the output range. By default, Vega-lite uses sequential scales to encode continuous (quantitative and temporal) fields with colors.
To customize the range of a sequential scale, either a range array listing colors or a color scheme can be specified.
Piecewise Scales
We can use any types of continuous scales ("linear", "pow", "sqrt", "log", "time", "utc", "sequential") to create a diverging color graph by specifying a custom domain with multiple elements.
If range is specified, the number of elements in range should match with the number of elements in domain. Diverging color schemes are also useful as a range for a piecewise scale.
Example
Discrete Scales
Discrete scales map values from a discrete domain to a discrete or continuous range.
Ordinal Scales
Ordinal scales ("ordinal") have a discrete domain and range. These scales function as a “lookup table” from a domain value to a range value.
By default, Vega-Lite automatically creates ordinal scales for color and shape channels. For example, the following plot implicitly has two ordinal scales, which map the values of the field "Origin" to a set of colors and a set of shapes.
The range of an ordinal scale can be an array of desired output values, which are directly mapped to elements in the domain. Both domain and range array can be re-ordered to specify the order and mapping between the domain and the output range. For ordinal color scales, a custom scheme can be set as well.
Band and Point Scales
Band and point scales accept a discrete domain similar to ordinal scales, but map this domain to a continuous, numeric output range such as pixels.
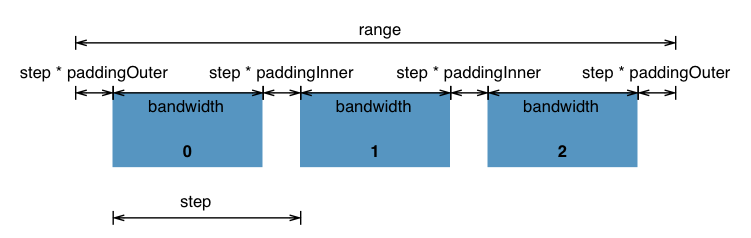
Band scales ("band") compute the discrete output values by dividing the continuous range into uniform bands. Band scales are typically used for bar charts with an ordinal or categorical dimension.
In addition to a standard numerical range value (such as [0, 500]), band scales can be given a fixed step size for each band. The actual range is then determined by both the step size and the cardinality (element count) of the input domain.
This image from the d3-scale documentation illustrates how a band scale works:
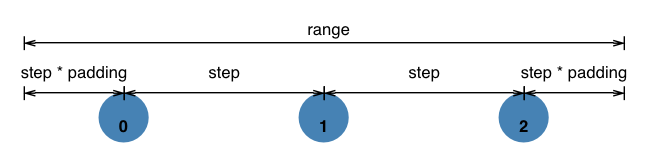
Point scales ("point") are a variant of band scales where the internal band width is fixed to zero. Point scales are typically used for scatterplots with an ordinal or categorical dimension. Similar to band scales, point scale range values may be specified using either a numerical extent ([0, 500]) or a step size ({"step": 20}).
This image from the d3-scale documentation illustrates how a point scale works:
By default, Vega-Lite uses band scales for nominal and ordinal fields on position channels (x and y) of bar or rect marks.
For x and y of other marks and size and opacity, Vega-Lite uses point scales by default.
For example, the following bar chart has uses a band scale for its x-position.
To customize the range of band and point scales, users can provide the following properties:
| Property | Type | Description |
|---|---|---|
| padding | Number |
For continuous scales, expands the scale domain to accommodate the specified number of pixels on each of the scale range. The scale range must represent pixels for this parameter to function as intended. Padding adjustment is performed prior to all other adjustments, including the effects of the zero, nice, domainMin, and domainMax properties. For band scales, shortcut for setting For point scales, alias for Default value: For continuous scales, derived from the scale config’s |
| paddingInner | Number |
The inner padding (spacing) within each band step of band scales, as a fraction of the step size. This value must lie in the range [0,1]. For point scale, this property is invalid as point scales do not have internal band widths (only step sizes between bands). Default value: derived from the scale config’s |
| paddingOuter | Number |
The outer padding (spacing) at the ends of the range of band and point scales, as a fraction of the step size. This value must lie in the range [0,1]. Default value: derived from the scale config’s |
| rangeStep | Number | Null |
The distance between the starts of adjacent bands or points in band and point scales. If Default value: derived the scale config’s Warning: If |
| round | Boolean |
If Default value: |
For example, we can set the rangeStep property to make the bands of the bars smaller.
Discretizing Scales
Discretizing scales break up a continuous domain into discrete segments, and then map values in each segment to a range value.
Bin-Linear Scales
Binned linear scales ("bin-linear") are a special type of linear scale for use with binned fields to correctly create legend labels.
Vega-Lite always uses binned linear scales with binned quantitative fields on size and opacity channels.
For example, the following plot has a binned field on the size channel.
Bin-Ordinal Scales
Binned ordinal scales ("bin-ordinal") are a special type of ordinal scale for use with binned fields to correctly create legend labels.
Vega-Lite always uses binned ordinal scales with binned quantitative fields on the color channel.
For example, the following plot has a binned field on the color channel.
Similar to ordinal color scales, a custom range or scheme can be specified for binned ordinal scales.
Disabling Scale
To directly encode the data value, the scale property can be set to null.
For example, the follow bar chart directly encodes color names in the data.
Configuration
// Top-level View Specification
{
  ...
  "config": {
    "scale": {
      ...                       // Scale Config
    },
    "range": {
      ...                       // Scale Range Config
    },
    ...
  }
  ...
}
Scale Config
To provide themes for all scales, the scale config (config: {scale: {...}}) can contain the following properties:
| Property | Type | Description |
|---|---|---|
| bandPaddingInner | Number |
Default inner padding for Default value: |
| bandPaddingOuter | Number |
Default outer padding for |
| clamp | Boolean |
If true, values that exceed the data domain are clamped to either the minimum or maximum range value |
| maxBandSize | Number |
The default max value for mapping quantitative fields to bar’s size/bandSize. If undefined (default), we will use the scale’s |
| minBandSize | Number |
The default min value for mapping quantitative fields to bar and tick’s size/bandSize scale with zero=false. Default value: |
| maxFontSize | Number |
The default max value for mapping quantitative fields to text’s size/fontSize. Default value: |
| minFontSize | Number |
The default min value for mapping quantitative fields to tick’s size/fontSize scale with zero=false Default value: |
| maxOpacity | Number |
Default max opacity for mapping a field to opacity. Default value: |
| minOpacity | Number |
Default minimum opacity for mapping a field to opacity. Default value: |
| maxSize | Number |
Default max value for point size scale. |
| minSize | Number |
Default minimum value for point size scale with zero=false. Default value: |
| maxStrokeWidth | Number |
Default max strokeWidth for the scale of strokeWidth for rule and line marks and of size for trail marks. Default value: |
| minStrokeWidth | Number |
Default minimum strokeWidth for the scale of strokeWidth for rule and line marks and of size for trail marks with zero=false. Default value: |
| pointPadding | Number |
Default outer padding for Default value: |
| rangeStep | Number | Null |
Default range step for band and point scales of (1) the Default value: |
| round | Boolean |
If true, rounds numeric output values to integers.
This can be helpful for snapping to the pixel grid.
(Only available for |
| textXRangeStep | Number |
Default range step for Default value: |
| useUnaggregatedDomain | Boolean |
Use the source data range before aggregation as scale domain instead of aggregated data for aggregate axis. This is equivalent to setting This property only works with aggregate functions that produce values within the raw data domain ( Default value: |
Range Config
The scale range configuration (config: {range: {...}}) defines key-value mapping for named scale ranges: the keys represent the range names, while the values define valid range or, for named color ranges, Vega scheme definitions.
By default, Vega-Lite (via Vega) includes the following pre-defined named ranges:
| Property | Type | Description |
|---|---|---|
| category | String[] | VgScheme |
Default range for nominal (categorical) fields. |
| diverging | String[] | VgScheme |
Default range for diverging quantitative fields. |
| heatmap | String[] | VgScheme |
Default range for quantitative heatmaps. |
| ordinal | String[] | VgScheme |
Default range for ordinal fields. |
| ramp | String[] | VgScheme |
Default range for quantitative and temporal fields. |
| symbol | String[] |
Default range palette for the |
See this file for the default values of named ranges.