Scales
Scales map data values (numbers, dates, categories, etc.) to visual values (pixels, colors, sizes). Scales are a fundamental building block of data visualization, as they determine the nature of visual encodings. Vega includes a range of scales for both continuous and discrete input data, and supports mappings for position, shape, size and color encodings.
To visualize scales, Vega specifications may include axes or legends. For more about supported color encodings, see the color scheme reference. Internally, Vega uses the scales provided by the d3-scale library; for more background see Introducing d3-scale by Mike Bostock.
Documentation Overview
Scale Properties
Properties shared across scale types.
| Property | Type | Description |
|---|---|---|
| name | String | Required. A unique name for the scale. Scales and projections share the same namespace; names must be unique across both. |
| type | String | The type of scale (default linear). See the scale type reference for more. |
| domain | Domain | The domain of input data values for the scale. For quantitative data, this can take the form of a two-element array with minimum and maximum values. For ordinal or categorical data, this may be an array of valid input values. The domain may also be specified as a reference to a data source. See the scale domain reference for more. |
| domainMax | Number | Sets the maximum value in the scale domain, overriding the domain property. The domainMax property is only intended for use with scales having continuous domains. |
| domainMin | Number | Sets the minimum value in the scale domain, overriding the domain property. The domainMin property is only intended for use with scales having continuous domains. |
| domainMid | Number | Inserts a single mid-point value into a two-element domain. The mid-point value must lie between the domain minimum and maximum values. This property can be useful for setting a midpoint for diverging color scales. The domainMid property is only intended for use with scales supporting continuous, piecewise domains. |
| domainRaw | Array | An array of raw values that, if non-null, directly overrides the domain property. This is useful for supporting interactions such as panning or zooming a scale. The scale may be initially determined using a data-driven domain, then modified in response to user input by setting the rawDomain value. |
| interpolate | String | Object | The interpolation method for range values. By default, continuous scales use a general interpolator for numbers, dates, strings and colors (in RGB space) is used. For color ranges, this property allows interpolation in alternative color spaces. Legal values include rgb, hsl, hsl-long, lab, hcl, hcl-long, cubehelix and cubehelix-long (‘-long’ variants use longer paths in polar coordinate spaces). If object-valued, this property accepts an object with a string-valued type property and an optional numeric gamma property applicable to rgb and cubehelix interpolators. For more, see the d3-interpolate documentation. |
| range | Range | The range of the scale, representing the set of visual values. For numeric values, the range typically takes the form of a two-element array with minimum and maximum values. For ordinal or quantized data, the range may be an array of desired output values, which are mapped to elements in the specified domain. See the scale range reference for more. |
| reverse | Boolean | A boolean flag (default false) that reverses the order of the scale range. |
| round | Boolean | A boolean flag (default false) that rounds numeric output values to integers. Helpful for snapping to a pixel grid. |
Scale Types
Quantitative Scales
A quantitative scale maps a continuous domain (numbers or dates) to a continuous output range (pixel locations, sizes, colors). The available quantitative scale type values are linear, log, pow, sqrt, symlog, time and utc. All quantitative scales except for time and utc use a default domain of [0, 1] and default unit range [0, 1].
All quantitative scales support color-valued ranges, defined either as an array of color strings or as a scheme specification. If the domain includes two color values, a sequential color scale is used. If the domain includes three color values, a diverging color scale is used. For larger domain sizes, the domain and range should have the same number of values, over which piecewise interpolation will be applied.
| Property | Type | Description |
|---|---|---|
| bins | Bins | ≥ 5.0 Bin boundaries over the scale domain, such as those computed by Vega’s bin transform. If provided, axes and legends will use the bin boundaries to inform the choice of axis tick marks and legend labels. This property can be either an explicit array of bin boundary values or a specification object, see the scale bins reference for more. |
| clamp | Boolean | A boolean indicating if output values should be clamped to the range (default false). If clamping is disabled and the scale is passed a value outside the domain, the scale may return a value outside the range through extrapolation. If clamping is enabled, the output value of the scale is always within the scale’s range. |
| padding | Number | Expands the scale domain to accommodate the specified number of pixels on each of the scale range. The scale range must represent pixels for this parameter to function as intended. Padding adjustment is performed prior to all other adjustments, including the effects of the zero, nice, domainMin, and domainMax properties. |
| nice | Boolean | Number | Signal | Extends the domain so that it starts and ends on nice round values (default false). This method typically modifies the scale’s domain, and may only extend the bounds to the nearest round value. Nicing is useful if the domain is computed from data and may be irregular. For example, for a domain of [0.201479…, 0.996679…], a nice domain might be [0.2, 1.0]. Domain values set via domainMin and domainMax (but not domainRaw) are subject to nicing. Using a number value for this parameter (representing a desired tick count) allows greater control over the step size used to extend the bounds, guaranteeing that the returned ticks will exactly cover the domain. |
| zero | Boolean | Boolean flag indicating if the scale domain should include zero. The default value is true for linear, sqrt and pow, and false otherwise. |
Linear Scales
Linear scales (linear) are quantitative scales scales that preserve proportional differences. Each range value y can be expressed as a linear function of the domain value x: y = mx + b.
Logarithmic Scales
Log scales (log) are quantitative scales scales in which a logarithmic transform is applied to the input domain value before the output range value is computed. Log scales are particularly useful for plotting data that varies over multiple orders of magnitude. The mapping to the range value y can be expressed as a logarithmic function of the domain value x: y = m log(x) + b.
As log(0) = -∞, a log scale domain must be strictly-positive or strictly-negative; the domain must not include or cross zero. A log scale with a positive domain has a well-defined behavior for positive values, and a log scale with a negative domain has a well-defined behavior for negative values. (For a negative domain, input and output values are implicitly multiplied by -1.) The behavior of the scale is undefined if you run a negative value through a log scale with a positive domain or vice versa.
| Property | Type | Description |
|---|---|---|
| base | Number | The base of the logarithm (default 10). |
Power Scales
Power scales (pow) are quantitative scales scales that apply an exponential transform to the input domain value before the output range value is computed. Each range value y can be expressed as a polynomial function of the domain value x: y = mx^k + b, where k is the exponent value. Power scales also support negative domain values, in which case the input value and the resulting output value are multiplied by -1.
| Property | Type | Description |
|---|---|---|
| exponent | Number | The exponent to use in the scale transform (default 1). |
Square Root Scales
Square root (sqrt) scales are a convenient shorthand for power scales with an exponent of 0.5, indicating a square root transform.
Symmetric Log Scales ≥ 5.0
Symmetric log scales (symlog) are quantitative scales scales that provide scaling similar to log scales, but supports non-positive numbers. Symlog scales are particularly useful for plotting data that varies over multiple orders of magnitude but includes negative- or zero-valued data. For more, see “A bi-symmetric log transformation for wide-range data” by Webber for more.
| Property | Type | Description |
|---|---|---|
| constant | Number | A constant determining the slope of the symlog function around zero (default 1). |
Time and UTC Scales
Time scales (time and utc) are quantitative scales with a temporal domain: values in the input domain are assumed to be Date objects or timestamps. The time scale type uses the current local timezone setting. UTC scales (utc) instead use Coordinated Universal Time. Both time and utc scales use a default domain of [2000-01-01, 2000-01-02], and a default unit range [0, 1].
| Property | Type | Description |
|---|---|---|
| nice | String | Object | Number | Boolean | If specified, modifies the scale domain to use a more human-friendly value range. For time and utc scale types, the nice value can additionally be a string indicating the desired time interval. Legal values are "millisecond", "second", "minute", "hour", "day", "week", "month", and "year". Alternatively, time and utc scales can accept an object-valued interval specifier of the form {"interval": "month", "step": 3}, which includes a desired number of interval steps. Here, the domain would snap to quarter (Jan, Apr, Jul, Oct) boundaries. |
Sequential Scales (Deprecated)
Sequential scales (sequential) are similar to linear scales, but use a fixed interpolator to determine the output range. As of Vega 5.0, sequential scales are deprecated: specifications should now use a linear (or log, etc.) scale with a color-valued range, rather than a sequential scale.
| Property | Type | Description |
|---|---|---|
| clamp | Boolean | A boolean indicating if output values should be clamped to the range (default false). If clamping is disabled and the scale is passed a value outside the domain, the scale may return a value outside the range through extrapolation. If clamping is enabled, the output value of the scale is always within the scale’s range. |
| domainMax | Number | Sets the maximum value in the scale domain, overriding the domain property. |
| domainMin | Number | Sets the minimum value in the scale domain, overriding the domain property. |
| domainMid | Number | Inserts a single mid-point value into a two-element domain. The mid-point value must lie between the domain minimum and maximum values. This property can be useful for setting a midpoint for diverging color scales. |
| range | Scheme | Color[ ] | Required. The range value should either be a color scheme object or an array of color strings. If an array of colors is provided, the array will be used to create a continuous interpolator via linear interpolation in the RGB color space. |
Discrete Scales
Discrete scales map values from a discrete domain to a discrete range. In the case of band and point scales, the range is determined by discretizing a continuous numeric range.
Ordinal Scales
Ordinal scales (ordinal) have a discrete domain and range. For example, an ordinal scale might map a set of named categories to a set of colors, or to a set of shapes. Ordinal scales function as a “lookup table” from a domain value to a range value.
This example uses an ordinal scale for color-coded categories, with up to 20 unique colors:
{
  "scales": [
    {
      "name": "color",
      "type": "ordinal",
      "domain": {"data": "table", "field": "category"},
      "range": {"scheme": "category20"}
    }
  ]
}
Band Scales
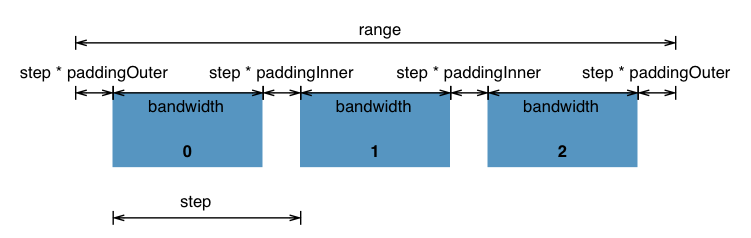
Band scales (band) accept a discrete domain similar to ordinal scales, but map this domain to a continuous, numeric output range such as pixels. Discrete output values are automatically computed by the scale by dividing the continuous range into uniform bands. Band scales are typically used for bar charts with an ordinal or categorical dimension.
In addition to a standard numerical range value (such as [0, 500]), band scales can be given a fixed step size for each band. The actual range is then determined by both the step size and the cardinality (element count) of the input domain. The step size is specified by an object with a step property that provides the step size in pixels, for example "range": {"step": 20}.
This image from the d3-scale documentation illustrates how a band scale works:
| Property | Type | Description |
|---|---|---|
| align | Number | The alignment of elements within the scale range. This value must lie in the range [0,1]. A value of 0.5 (default) indicates that the bands should be centered within the range. A value of 0 or 1 may be used to shift the bands to one side, say to position them adjacent to an axis. For more, see this explainer for D3 band align. |
| domainImplicit | Boolean | A boolean flag (default false) indicating if an ordinal domain should be implicitly extended with new values. If false, the scale will return undefined for values not explicitly included in the domain. If true, new values will be appended to the domain and the matching range value will be returned. |
| padding | Number | Sets paddingInner and paddingOuter to the same padding value (default 0). This value must lie in the range [0,1]. |
| paddingInner | Number | The inner padding (spacing) within each band step, as a fraction of the step size (default 0). This value must lie in the range [0,1]. |
| paddingOuter | Number | The outer padding (spacing) at the ends of the scale range, as a fraction of the step size (default 0). This value must lie in the range [0,1]. |
Point Scales
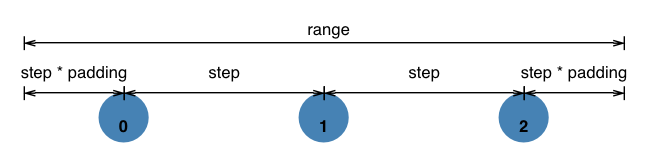
Point scales (point) are a variant of band scales where the internal band width is fixed to zero. Point scales are typically used for scatterplots with an ordinal or categorical dimension. Similar to band scales, point scale range values may be specified using either a numerical extent ([0, 500]) or a step size ({"step": 20}). As point scales do not have internal band widths (only step sizes between bands), they do not accept the paddingInner property.
This image from the d3-scale documentation illustrates how a point scale works:
| Property | Type | Description |
|---|---|---|
| align | Number | The alignment of elements within the scale range. This value must lie in the range [0,1]. A value of 0.5 (default) indicates that the points should be centered within the range. A value of 0 or 1 may be used to shift the points to one side, say to position them adjacent to an axis. |
| padding | Number | An alias for paddingOuter (default 0). This value must lie in the range [0,1]. |
| paddingOuter | Number | The outer padding (spacing) at the ends of the scale range, as a fraction of the step size (default 0). This value must lie in the range [0,1]. |
Discretizing Scales
Discretizing scales break up a continuous domain into discrete segments, and then map values in each segment to a range value.
Quantile Scales
Quantile scales (quantile) map a sample of input domain values to a discrete range based on computed quantile boundaries. The domain is considered continuous and thus the scale will accept any reasonable input value; however, the domain is specified as a discrete set of sample values. The number of values in (i.e., the cardinality of) the output range determines the number of quantiles that will be computed from the domain. To compute the quantiles, the domain is sorted, and treated as a population of discrete values. The resulting quantile boundaries segment the domain into groups with roughly equal numbers of sample points per group.
Quantile scales are particularly useful for creating color or size encodings with a fixed number of output values. Using a discrete set of encoding levels (typically between 5-9 colors or sizes) sometimes supports more accurate perceptual comparison than a continuous range. For related functionality see quantize scales, which partition the domain into uniform domain extents, rather than groups with equal element counts. Quantile scales have the benefit of evenly distributing data points to encoded values. In contrast, quantize scales uniformly segment the input domain and provide no guarantee on how data points will be distributed among the output visual values.
This example color-codes quantile values in five groups, using colors sampled from a continuous color scheme:
{
  "name": "color",
  "scale": "quantile",
  "domain": {"data": "table", "field": "value"},
  "range": {"scheme": "plasma", "count": 5}
}
Quantize Scales
Quantize scales (quantize) are similar to linear scales, except they use a discrete rather than continuous range. The continuous input domain is divided into uniform segments based on the number of values in (i.e., the cardinality of) the output range. Each range value y can be expressed as a quantized linear function of the domain value x: y = m round(x) + b.
Quantize scales are particularly useful for creating color or size encodings with a fixed number of output values. Using a discrete set of encoding levels (typically between 5-9 colors or sizes) sometimes supports more accurate perceptual comparison than a continuous range. For related functionality see quantile scales, which partition the domain into groups with equal element counts, rather than uniform domain extents.
| Property | Type | Description |
|---|---|---|
| nice | Boolean | Number | Extends the domain so that it starts and ends on nice round values (default false). This method typically modifies the scale’s domain, and may only extend the bounds to the nearest round value. Nicing is useful if the domain is computed from data and may be irregular. For example, for a domain of [0.201479…, 0.996679…], a nice domain might be [0.2, 1.0]. Domain values set via domainMin and domainMax (but not domainRaw) are subject to nicing. Using a number value for this parameter (representing a desired tick count) allows greater control over the step size used to extend the bounds, guaranteeing that the returned ticks will exactly cover the domain. |
| zero | Boolean | Boolean flag indicating if the scale domain should include zero (default false). |
This example color-codes a quantized domain using a 7-point color scheme:
{
  "name": "color",
  "scale": "quantize",
  "domain": {"data": "table", "field": "value"},
  "range": {"scheme": "blues", "count": 7}
}
Threshold Scales
Threshold scales (threshold) are similar to quantize scales, except they allow mapping of arbitrary subsets of the domain (not uniform segments) to discrete values in the range. The input domain is still continuous, and divided into slices based on a set of threshold values provided to the domain property. The range property must have N+1 elements, where N is the number of threshold boundaries provided in the domain.
Given the following scale definition,
{
  "name": "threshold",
  "type": "threshold",
  "domain": [0, 1],
  "range": ["red", "white", "blue"]
}
the scale will map domain values to color strings as follows:
-1   => "red"
0    => "white"
0.5  => "white"
1.0  => "blue"
1000 => "blue"
Bin-Ordinal Scales
Binned ordinal scales (bin-ordinal) are a special type of ordinal scale for use with data that has been subdivided into bins (for example, using Vega’s bin transform). The main benefit of using bin-ordinal scales is that they provide “bin-aware” routines for sampling values and generating labels for inclusion in legends. They are particularly useful for creating binned color encodings.
The domain values for a binned ordinal scale must be the set of all bin boundaries, from the minimum bin start to maximum bin end. Input domain values are discretized to the appropriate bin, which is then treated as a standard ordinal scale input. However, as the domain property only accepts an array of values, the bin-ordinal scale provides a bins property that also accepts a bin specification and can be used instead of an explicit domain property.
| Property | Type | Description |
|---|---|---|
| bins | Bins | ≥ 5.0 Bin boundaries over the scale domain, such as those computed by Vega’s bin transform. This property can be either an explicit array of bin boundary values or a specification object, see the scale bins reference for more. If the domain property is not defined, bins will be used to determine the scale domain. |
Here is an example of a bin-ordinal scale defined in conjunction with a bin transform:
{
  "data": [
    {
      "name": "input",
      "transform": [
        { "type": "extent", "field": "value", "signal": "extent" },
        { "type": "bin", "extent": {"signal": "extent"}, "signal": "bins" }
      ]
    }
  ],
  "scales": [
    {
      "name": "color",
      "type": "bin-ordinal",
      "bins": {"signal": "bins"},
      "range": {"scheme": "greens"}
    }
  ]
}
Scale Bins
Bin boundaries can be provided to scales as either an explicit array of bin boundaries or as a bin specification object. The legal values are:
- A signal reference that resolves to either an array or bin specification object.
- An array literal of bin boundary values. For example,
[0, 5, 10, 15, 20]. The array must include both starting and ending boundaries. The previous example uses five values to indicate a total of four bin intervals: [0-5), [5-10), [10-15), [15-20]. Array literals may include signal references as elements. - A bin specification object that indicates the bin step size, and optionally the start and stop boundaries. The output value of a
bintransform is a valid bin specification object.
| Property | Type | Description |
|---|---|---|
| start | Number | The starting (lowest-valued) bin boundary. If not defined, the lowest value of the scale domain will be used. |
| stop | Number | The stopping (highest-valued) bin boundary. If not defined, the highest value of the scale domain will be used. |
| step | Number | Required. The step size defining the bin interval width. |
Scale Domains
Scale domains can be specified in multiple ways:
- As an array literal of domain values. For example,
[0, 500]or['a', 'b', 'c']. Array literals may include signal references as elements. - A signal reference that resolves to a domain value array. For example,
{"signal": "myDomain"}. - A data reference object that specifies field values in one or more data sets.
Basic Data Reference
A basic data reference indicates a data set, field name, and optional sorting for discrete scales:
| Property | Type | Description |
|---|---|---|
| data | String | Required. The name of the data set containing domain values. |
| field | Field | Required. The name of the data field (e.g., "price"). |
| sort | Boolean | Sort | If a boolean true value, sort the domain values in ascending order. If object-valued, sort the domain according to the provided sort parameters. Sorting is only supported for discrete scale types. |
For example, "domain": {"data": "table", "field": "value"}, derives a scale domain from the value field of data objects in the table data set. If the scale type is quantitative or a quantize, the derived domain will be a two-element [min, max] array. If the scale type is discrete, the derived domain will be an array of all distinct values. If the scale type is quantile, all values will be used to compute quantile boundaries.
Multi-Field Data References
Scale domains can also be derived using values from multiple fields. Multiple fields from the same data set can be specified by replacing the field property with a fields property that takes an array of field names:
| Property | Type | Description |
|---|---|---|
| data | String | Required. The name of the data set containing domain values. |
| fields | Field[ ] | Required. The names of the data field (e.g., ["price", "cost"]). |
| sort | Boolean | Sort | If a boolean true value, sort the domain values in ascending order. If object-valued, sort the domain according to the provided sort parameters. Sorting is only supported for discrete scale types. |
More generally, scale domains may also use values pulled from different data sets. In this case, the domain object should have a fields property, which is an array of basic data references:
| Property | Type | Description |
|---|---|---|
| fields | DataRef[ ] | Required. An array of basic data references indicating each data set and field value to include in the domain. In addition, array literals (e.g., [0, 100], ["a", "b", "c"]) may be included as elements of the fields array for inclusion in the domain determination. |
| sort | Boolean | Sort | If a boolean true value, sort the domain values in ascending order. If object-valued, sort the domain according to the provided sort parameters. Sorting is only supported for discrete scale types. |
Here is an example that constructs a domain using the fields price and cost drawn from two different data sets:
"domain": {
  "fields": [
    {"data": "table1", "field": "price"},
    {"data": "table2", "field": "cost"}
   ]
}
Sorting Domains
The sort property of a domain data reference can accept, in addition to a simple boolean, an object-valued sort definition:
| Property | Type | Description |
|---|---|---|
| field | Field | The data field to sort by. If unspecified, defaults to the field specified in the outer data reference. |
| op | String | An aggregate operation to perform on the field prior to sorting. Examples include count, mean and median. This property is required in cases where the sort field and the data reference field do not match. The input data objects will be aggregated, grouped by data reference field values. For a full list of operations, see the aggregate transform, and also see below for limitations with multi-field domains. |
| order | String | The sort order. One of ascending (default) or descending. |
This example sorts distinct category field values in descending order by the associated median of the value field:
{
  "domain": {
    "data": "table",
    "field": "category",
    "sort": {"op": "median", "field": "value", "order": "descending"}
  }
}
This example sorts a multi-field domain in descending order based on the counts of each of the domain values:
{
  "domain": {
    "data": "table",
    "fields": ["category1", "category2"],
    "sort": {"op": "count", "order": "descending"}
  }
}
Note: For multi-field domains, the sort field values may not be undefined across all input data sets, and will exhibit duplicate values when drawing multiple domain values from the same data set. To avoid inaccurate sorting, the only allowed sort op values for multi-domain scales are count, min, and max. Support for min and max is available in versions ≥ 5.5.
Scale Ranges
Scale ranges can be specified in multiple ways:
- As an array literal of range values. For example,
[0, 500]or['a', 'b', 'c']. Array literals may include signal references as elements. - A signal reference that resolves to a range value array. For example,
{"signal": "myRange"}. - A color scheme reference for a color palette. For example,
{"scheme": "blueorange"}. - For
ordinalscales only, a data reference for a set of distinct field values. For example,{"data": "table", "field": "value"}. - For
bandandpointscales only, a step size for each range band. For example,{"step": 20}. - A string indicating a pre-defined scale range default. For example,
"width","symbol", or"diverging".
Scale Range Defaults
Scale ranges can also accept string literals that map to default values. Default values can be modified, and new named defaults can be added, by using custom config settings.
| Value | Description |
|---|---|
"width" |
A spatial range determined by the value of the width signal. |
"height" |
A spatial range determined by the value of the height signal. The direction of the range (top-to-bottom or bottom-to-top) is automatically determined according to the scale type. |
"symbol" |
The default plotting symbol set to use for shape encodings. |
"category" |
The default categorical color scheme to use for nominal data. |
"diverging" |
The default diverging color scheme to use for quantitative data. |
"ordinal" |
The default sequential color scheme to use for ordinal data. |
"ramp" |
The default sequential color scheme to use for quantitative data. |
"heatmap" |
The default sequential color scheme to use for quantitative heatmaps. |