windvectors
Simulated wind vectors over northwestern Europe
Simulated wind patterns over northwestern Europe.
CSV 4,800 rows 5 fields 129 KB 3 gallery examples 3 examples License not specified
Fields
| Field | Type | Distribution | Summary | Missing |
|---|---|---|---|---|
longitudeAdd a description for longitude | number | -9.88 – 9.88 · mean 0 | Missing 0 | |
latitudeAdd a description for latitude | number | 45.12 – 59.88 · mean 52.5 | Missing 0 | |
dirAdd a description for dir | integer | 0 – 360 · mean 154.9 | Missing 0 | |
dirCatAdd a description for dirCat | integer | 0 – 360 · mean 154.8 | Missing 0 | |
speedAdd a description for speed | number | 0.01 – 12.18 · mean 4.54 | Missing 0 |
Profiled across all 4,800 rows. No field descriptions yet. Add them
Explore
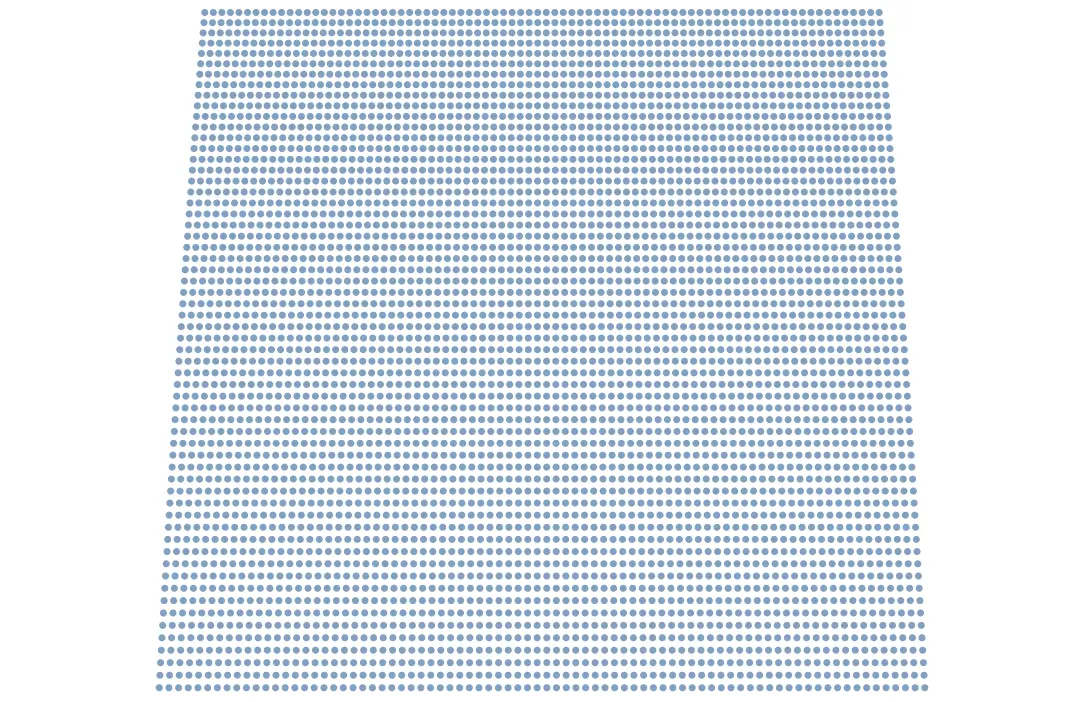
Vega-Lite · circle mark · equalEarth projection · tooltipVega-Lite · circle mark · equalEarth projection · tooltip
Open This Chart in the Vega Editor Preview
| longitude | latitude | dir | dirCat | speed |
|---|---|---|---|---|
| 0.125 | 45.125 | 228 | 225 | 3.12 |
| 0.375 | 45.125 | 228 | 225 | 3.24 |
| 0.625 | 45.125 | 229 | 225 | 3.34 |
| 0.875 | 45.125 | 229 | 225 | 3.44 |
| 1.125 | 45.125 | 228 | 225 | 3.48 |
Scroll sideways for all 5 fields.
Examples
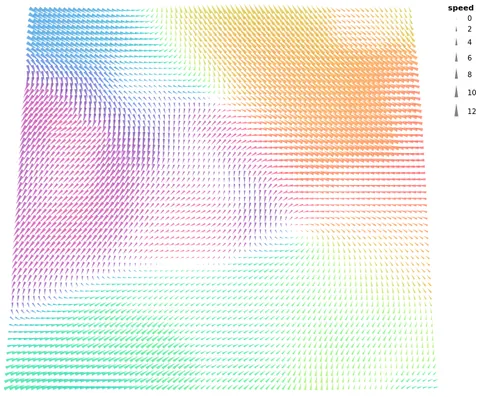

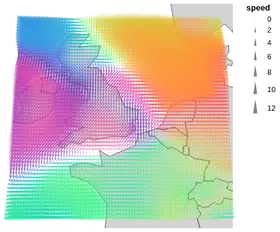
Vega and Vega-Lite examples open in the Editor with this dataset loaded. Altair examples link to their Python source.
Provenance
- Source
-
No source recorded.
- License
-
Not specified. Check the source's terms before reuse.
- File
data/windvectors.csv· 129,253 bytes · View on GitHub