wheat
Playfair's wheat prices and wages from 1565–1820
As noted by in this protovis example, "In an 1822 letter to Parliament, William Playfair, a Scottish engineer who is often credited as the founder of statistical graphics, published an elegant chart on the price of wheat. It plots 250 years of prices alongside weekly wages and the reigning monarch. He intended to demonstrate that:
'never at any former period was wheat so cheap, in proportion to mechanical labour, as it is at the present time.'"
JSON 52 rows 3 fields 2.1 KB 12 gallery examples 12 examples
Fields
| Field | Type | Distribution | Summary | Missing |
|---|---|---|---|---|
yearAdd a description for year | integer | 1,565 – 1,820 · mean 1,692 | Missing 0 | |
wheatAdd a description for wheat | number | 26 – 99 · mean 43.06 | Missing 0 | |
wagesAdd a description for wages | number | 5 – 30 · mean 11.58 | Missing 2 · 3.8% |
Profiled across all 52 rows. No field descriptions yet. Add them
Explore
Pick two fields. Scroll to zoom, drag to pan. Both fields have values in 50 of 52 rows.Pick two fields. Both fields have values in 50 of 52 rows. Vega-Lite · input binding · scale bindingVega-Lite · input binding
Open This Chart in the Vega Editor Preview
| year | wheat | wages |
|---|---|---|
| 1565 | 41 | 5 |
| 1570 | 45 | 5.05 |
| 1575 | 42 | 5.08 |
| 1580 | 49 | 5.12 |
| 1585 | 41.5 | 5.15 |
Examples
-
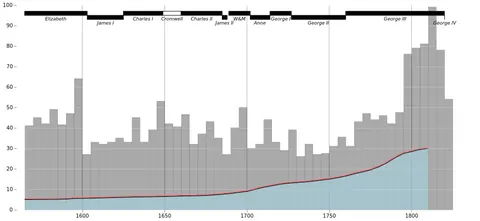 Wheat and Wages Example Open in Vega Editor
 -
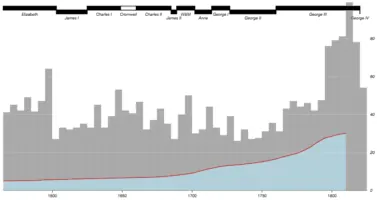 Wheat and Wages Open in Vega Editor
 -
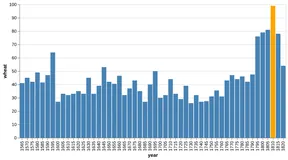 Bar Chart with Highlighted Bar Python Source
 -
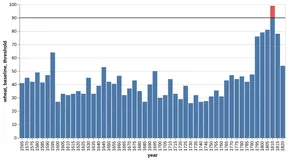 Bar Chart with Highlighted Segment Python Source
 -
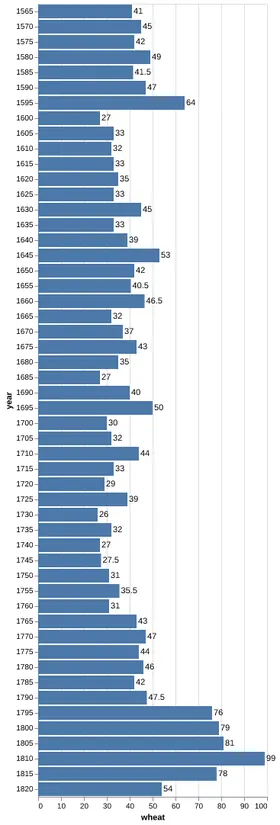 Bar Chart with Labels Python Source
 -
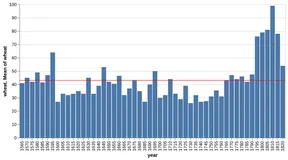 Bar Chart with Line at Mean Python Source
 -
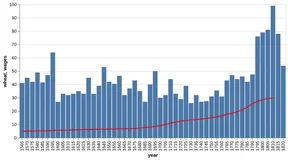 Bar Chart with Line on Dual Axis Python Source
 -
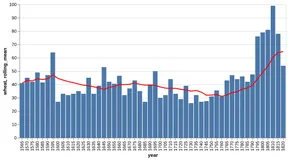 Bar Chart with Rolling Mean Python Source
 -
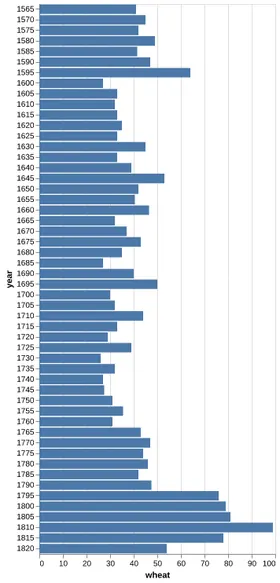 Horizontal Bar Chart Python Source
 -
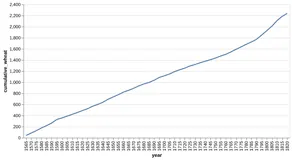 Line Chart with Cumulative Sum Python Source
 -
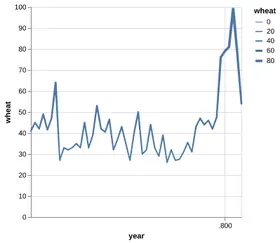 Line Chart with Varying Size Python Source
 -
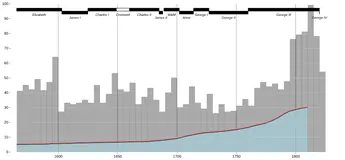 Wheat and Wages Python Source
Vega and Vega-Lite examples open in the Editor with this dataset loaded. Altair examples link to their Python source.
Provenance
- Source
- License
-
- Public Domain (other-pd)
- File
data/wheat.json· 2,085 bytes · View on GitHub