us_employment
U.S. monthly employment totals by sector
Monthly employment total in a variety of job categories from January 2006 through December 2015, seasonally adjusted and reported in thousands. Downloaded and reformatted on Nov. 11, 2018.
In the mid 2000s the global economy was hit by a crippling recession. One result: Massive job losses across the United States. The downturn in employment, and the slow recovery in hiring that followed, was tracked each month by the Current Employment Statistics program at the U.S. Bureau of Labor Statistics.
Totals are included for the 22 "supersectors" tracked by the BLS. The "nonfarm" total is the category typically used by economists and journalists as a stand-in for the country's employment total.
A calculated "nonfarm_change" column has been appended with the month-to-month change in that supersector's employment. It is useful for illustrating how to make bar charts that report both negative and positive values.
Fields
| Field | Type | Distribution | Summary | Missing |
|---|---|---|---|---|
monthAdd a description for month | date | Jan 1, 2006 – Dec 1, 2015 | Missing 0 | |
nonfarmAdd a description for nonfarm | integer | 129,700 – 143,100 · mean 135,700 | Missing 0 | |
privateAdd a description for private | integer | 107,200 – 121,000 · mean 113,500 | Missing 0 | |
goods_producingAdd a description for goods_producing | integer | 17,630 – 22,630 · mean 19,640 | Missing 0 | |
service_providingAdd a description for service_providing | integer | 112,000 – 123,400 · mean 116,000 | Missing 0 | |
private_service_providingAdd a description for private_service_providing | integer | 89,510 – 101,300 · mean 93,860 | Missing 0 | |
mining_and_loggingAdd a description for mining_and_logging | integer | 656 – 904 · mean 777.4 | Missing 0 | |
constructionAdd a description for construction | integer | 5,427 – 7,726 · mean 6,365 | Missing 0 | |
manufacturingAdd a description for manufacturing | integer | 11,450 – 14,230 · mean 12,500 | Missing 0 | |
durable_goodsAdd a description for durable_goods | integer | 6,985 – 9,028 · mean 7,833 | Missing 0 | |
nondurable_goodsAdd a description for nondurable_goods | integer | 4,434 – 5,228 · mean 4,668 | Missing 0 | |
trade_transportation_utiltiesAdd a description for trade_transportation_utilties | integer | 24,480 – 27,040 · mean 25,840 | Missing 0 | |
wholesale_tradeAdd a description for wholesale_trade | number | 5,439 – 6,042 · mean 5,751 | Missing 0 | |
retail_tradeAdd a description for retail_trade | number | 14,330 – 15,700 · mean 15,070 | Missing 0 | |
transportation_and_warehousingAdd a description for transportation_and_warehousing | number | 4,117 – 4,951 · mean 4,469 | Missing 0 | |
utilitiesAdd a description for utilities | number | 546.6 – 563.6 · mean 553.7 | Missing 0 | |
informationAdd a description for information | integer | 2,634 – 3,055 · mean 2,809 | Missing 0 | |
financial_activitiesAdd a description for financial_activities | integer | 7,676 – 8,394 · mean 7,992 | Missing 0 | |
professional_and_business_servicesAdd a description for professional_and_business_services | integer | 16,390 – 19,890 · mean 17,900 | Missing 0 | |
education_and_health_servicesAdd a description for education_and_health_services | integer | 17,950 – 22,320 · mean 20,130 | Missing 0 | |
leisure_and_hospitalityAdd a description for leisure_and_hospitality | integer | 12,930 – 15,410 · mean 13,730 | Missing 0 | |
other_servicesAdd a description for other_services | integer | 5,315 – 5,652 · mean 5,460 | Missing 0 | |
governmentAdd a description for government | integer | 21,810 – 23,000 · mean 22,150 | Missing 0 | |
nonfarm_changeAdd a description for nonfarm_change | integer | -802 – 522 · mean 66.04 | Missing 0 |
Profiled across all 120 rows. No field descriptions yet. Add them
Explore
Preview
| month | nonfarm | private | goods_producing | service_providing | private_service_providing | mining_and_logging | construction | manufacturing | durable_goods | nondurable_goods | trade_transportation_utilties | wholesale_trade | retail_trade | transportation_and_warehousing | utilities | information | financial_activities | professional_and_business_services | education_and_health_services | leisure_and_hospitality | other_services | government | nonfarm_change |
|---|---|---|---|---|---|---|---|---|---|---|---|---|---|---|---|---|---|---|---|---|---|---|---|
| 2006-01-01 | 135450 | 113603 | 22467 | 112983 | 91136 | 656 | 7601 | 14210 | 8982 | 5228 | 26162 | 5840.4 | 15351.5 | 4420 | 549.8 | 3052 | 8307 | 17299 | 17946 | 12945 | 5425 | 21847 | 282 |
| 2006-02-01 | 135762 | 113884 | 22535 | 113227 | 91349 | 662 | 7664 | 14209 | 8986 | 5223 | 26196 | 5854.8 | 15361.3 | 4429.4 | 550.1 | 3052 | 8332 | 17365 | 17998 | 12980 | 5426 | 21878 | 312 |
| 2006-03-01 | 136059 | 114156 | 22572 | 113487 | 91584 | 669 | 7689 | 14214 | 9000 | 5214 | 26239 | 5873.3 | 15388 | 4429.7 | 547.5 | 3055 | 8348 | 17438 | 18045 | 13034 | 5425 | 21903 | 297 |
| 2006-04-01 | 136227 | 114308 | 22631 | 113596 | 91677 | 679 | 7726 | 14226 | 9020 | 5206 | 26230 | 5886.9 | 15348.5 | 4445.4 | 548.9 | 3046 | 8369 | 17462 | 18070 | 13074 | 5426 | 21919 | 168 |
| 2006-05-01 | 136258 | 114332 | 22597 | 113661 | 91735 | 681 | 7713 | 14203 | 9017 | 5186 | 26223 | 5897.2 | 15318.1 | 4459.4 | 548.3 | 3039 | 8376 | 17512 | 18100 | 13052 | 5433 | 21926 | 31 |
Scroll sideways for all 24 fields.
Examples
-
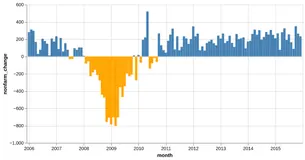 Bar Chart with Negative Values Python Source
 -
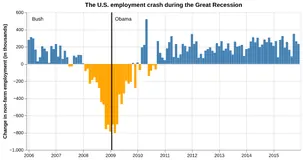 The U.S. Employment Crash During the Great Recession Python Source
Vega and Vega-Lite examples open in the Editor with this dataset loaded. Altair examples link to their Python source.
Provenance
- Source
- License
-
- U.S. Government Dataset (other-pd)
- File
data/us-employment.csv· 17,841 bytes · View on GitHub