uniform_2d
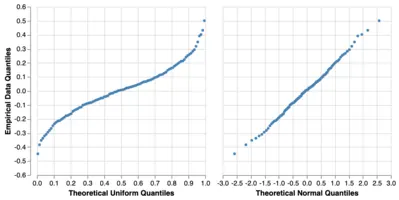
Simulated points from a bivariate uniform distribution
Five hundred paired coordinates (u, v) sampled from a bivariate uniform distribution. Centered near the
origin with ranges spanning approximately [-0.5, 0.5] in both dimensions. The variables exhibit negligible
correlation (-0.019), suggesting independence, as expected for a uniform distribution.
A contrast to normally distributed data in normal-2d.json.
JSON 500 rows 2 fields 34 KB 1 gallery example 1 example
Fields
| Field | Type | Distribution | Summary | Missing |
|---|---|---|---|---|
umean: 0.015, std: 0.277, range: [-0.499, 0.500] | number | -0.499 – 0.5 · mean 0.015 | Missing 0 | |
vmean: -0.013, std: 0.276, range: [-0.500, 0.498] | number | -0.5 – 0.498 · mean -0.013 | Missing 0 |
Profiled across all 500 rows.
Explore
Pick two fields. Scroll to zoom, drag to pan. Both fields have values in 500 of 500 rows.Pick two fields. Both fields have values in 500 of 500 rows. Vega-Lite · input binding · scale bindingVega-Lite · input binding
Open This Chart in the Vega Editor Preview
| u | v |
|---|---|
| -0.21984669543846058 | 0.23587774348711693 |
| 0.006569739430068278 | -0.0902683222414089 |
| -0.10265040798774261 | -0.47597690463684283 |
| 0.03320225303401708 | -0.25564546455266945 |
| -0.15693816022147677 | 0.12356301485763538 |
Examples
Vega and Vega-Lite examples open in the Editor with this dataset loaded. Altair examples link to their Python source.
Provenance
- Source
-
- Generated Data
- License
- File
data/uniform-2d.json· 34,217 bytes · View on GitHub