unemployment_across_industries
U.S. unemployment by industry over time
Industry-level unemployment from the Current Population Survey
(CPS), published monthly by the U.S. Bureau of Labor Statistics. Includes unemployed persons
and unemployment rate across 11 private industries, as well as agricultural, government, and
self-employed workers. Covers January 2000 through February 2010. Industry classification
follows format of CPS Table A-31. Transformed using scripts/make-unemployment-across-industries.py
The BLS Web site states:
"Users of the public API should cite the date that data were accessed or retrieved using the API. Users must clearly state that "BLS.gov cannot vouch for the data or analyses derived from these data after the data have been retrieved from BLS.gov." The BLS.gov logo may not be used by persons who are not BLS employees or on products (including web pages) that are not BLS-sponsored."
See full BLS terms of service.
Fields
| Field | Type | Distribution | Summary | Missing |
|---|---|---|---|---|
seriesIndustry name | string | 14 distinct | Agriculture 122 · Business services 122 · Construction 122 | Missing 0 |
yearYear (2000-2010) | integer | 2,000 – 2,010 · mean 2,005 | Missing 0 | |
monthMonth (1-12) | integer | 1 – 12 · mean 6.42 | Missing 0 | |
countNumber of unemployed persons (in thousands) | integer | 2 – 2,440 · mean 552.9 | Missing 0 | |
rateUnemployment rate (percentage) | number | 0.3 – 27.1 · mean 5.67 | Missing 0 | |
dateISO 8601-formatted date string (e.g., "2000-01-01T08:00:00.000Z") | datetime | Jan 1, 2000, 08:00 AM – Feb 1, 2010, 08:00 AM | Missing 0 |
Profiled across all 1,708 rows.
Explore
Preview
| series | year | month | count | rate | date |
|---|---|---|---|---|---|
| Government | 2000 | 1 | 430 | 2.1 | 2000-01-01T08:00:00.000Z |
| Government | 2000 | 2 | 409 | 2 | 2000-02-01T08:00:00.000Z |
| Government | 2000 | 3 | 311 | 1.5 | 2000-03-01T08:00:00.000Z |
| Government | 2000 | 4 | 269 | 1.3 | 2000-04-01T08:00:00.000Z |
| Government | 2000 | 5 | 370 | 1.9 | 2000-05-01T07:00:00.000Z |
Scroll sideways for all 6 fields.
Examples
-
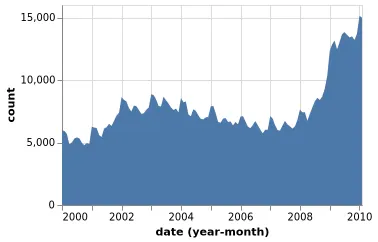 Area Chart Open in Vega Editor
 -
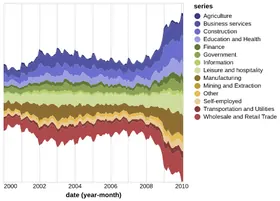 Interactive Legend Python Source
 -
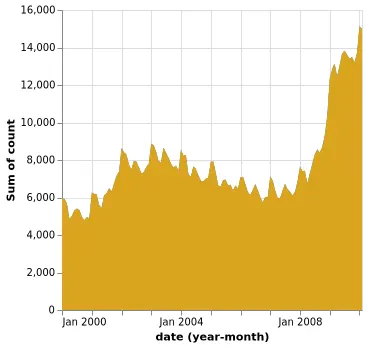 Area Chart with Rectangular Brush Open in Vega Editor
 -
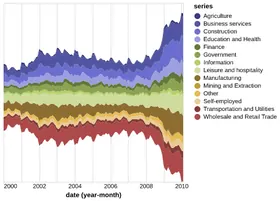 Streamgraph Python Source
 -
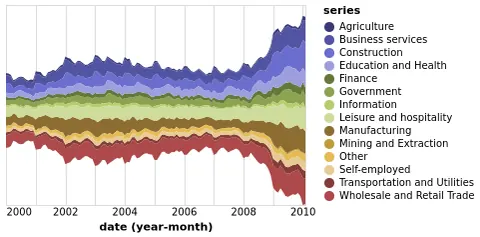 Interactive Legend Open in Vega Editor
 -
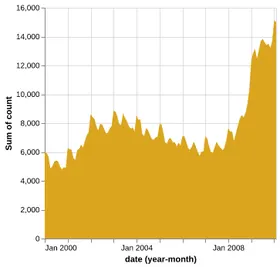 Using Selection Interval with mark_area Python Source
 -
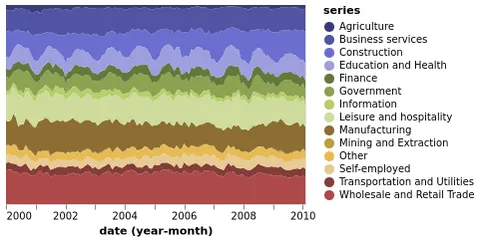 Normalized Stacked Area Chart Open in Vega Editor
 -
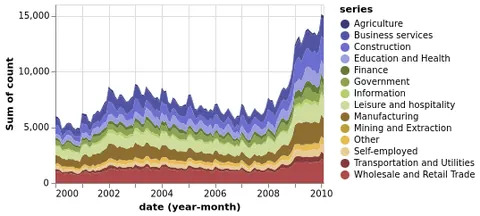 Stacked Area Chart Open in Vega Editor
 -
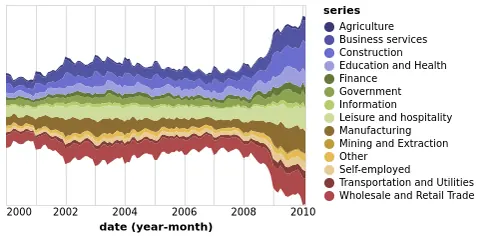 Streamgraph Open in Vega Editor
Vega and Vega-Lite examples open in the Editor with this dataset loaded. Altair examples link to their Python source.
Provenance
- Source
- License
-
- U.S. Government Dataset (other-pd)
- File
data/unemployment-across-industries.json· 185,641 bytes · View on GitHub