sp500_2000
S&P 500 daily index values and volume
S&P 500 index values from 2000 to 2020.
CSV 5,105 rows 7 fields 416 KB 1 gallery example 1 example License not specified
Fields
| Field | Type | Distribution | Summary | Missing |
|---|---|---|---|---|
dateAdd a description for date | date | Jan 3, 2000 – Apr 17, 2020 | Missing 0 | |
openAdd a description for open | number | 679.3 – 3,380 · mean 1,595 | Missing 0 | |
highAdd a description for high | number | 695.3 – 3,394 · mean 1,605 | Missing 0 | |
lowAdd a description for low | number | 666.8 – 3,379 · mean 1,585 | Missing 0 | |
closeAdd a description for close | number | 676.5 – 3,386 · mean 1,596 | Missing 0 | |
adjcloseAdd a description for adjclose | number | 676.5 – 3,386 · mean 1,596 | Missing 0 | |
volumeAdd a description for volume | integer | 356,100,000 – 11,460,000,000 · mean 3,124,000,000 | Missing 0 |
Profiled across all 5,105 rows. No field descriptions yet. Add them
Explore
Pick two fields. Scroll to zoom, drag to pan. Both fields have values in 5,105 of 5,105 rows.Pick two fields. Both fields have values in 5,105 of 5,105 rows. Vega-Lite · input binding · scale bindingVega-Lite · input binding
Open This Chart in the Vega Editor Preview
| date | open | high | low | close | adjclose | volume |
|---|---|---|---|---|---|---|
| 2000-01-03 | 1469.250000 | 1478.000000 | 1438.359985 | 1455.219971 | 1455.219971 | 931800000 |
| 2000-01-04 | 1455.219971 | 1455.219971 | 1397.430054 | 1399.420044 | 1399.420044 | 1009000000 |
| 2000-01-05 | 1399.420044 | 1413.270020 | 1377.680054 | 1402.109985 | 1402.109985 | 1085500000 |
| 2000-01-06 | 1402.109985 | 1411.900024 | 1392.099976 | 1403.449951 | 1403.449951 | 1092300000 |
| 2000-01-07 | 1403.449951 | 1441.469971 | 1400.729980 | 1441.469971 | 1441.469971 | 1225200000 |
Scroll sideways for all 7 fields.
Examples
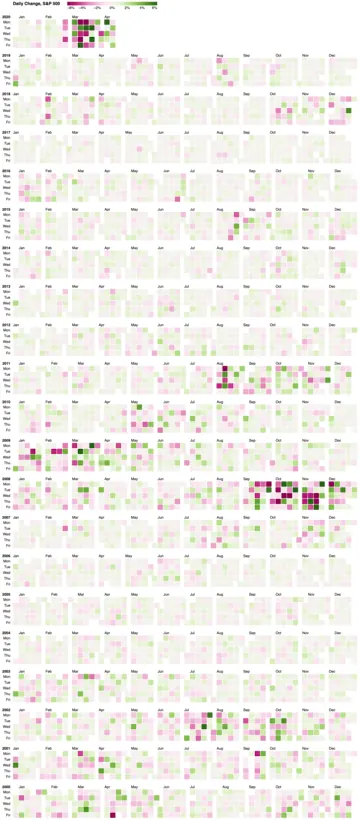
Vega and Vega-Lite examples open in the Editor with this dataset loaded. Altair examples link to their Python source.
Provenance
- Source
- License
-
Not specified. Check the source's terms before reuse.
- File
data/sp500-2000.csv· 415,968 bytes · View on GitHub