sp500
S&P 500 monthly closing values
Monthly closing values of the S&P 500 stock market index from January 2000 to March 2010. Captures several significant market events including the dot-com bubble burst (2000-2002), the mid-2000s bull market, and the 2008 financial crisis.
CSV 123 rows 2 fields 2.3 KB 3 gallery examples 3 examples License not specified
Fields
| Field | Type | Distribution | Summary | Missing |
|---|---|---|---|---|
dateDate of monthly observation in the format 'MMM D YYYY' | date%b %d %Y | Jan 1, 2000 – Mar 1, 2010 | Missing 0 | |
priceClosing price of the S&P 500 index for the given month | number | 735.1 – 1,549 · mean 1,184 | Missing 0 |
Profiled across all 123 rows.
Explore
Vega-Lite · line mark · tooltipVega-Lite · line mark · tooltip
Open This Chart in the Vega Editor Preview
| date | price |
|---|---|
| Jan 1 2000 | 1394.46 |
| Feb 1 2000 | 1366.42 |
| Mar 1 2000 | 1498.58 |
| Apr 1 2000 | 1452.43 |
| May 1 2000 | 1420.6 |
Examples
-
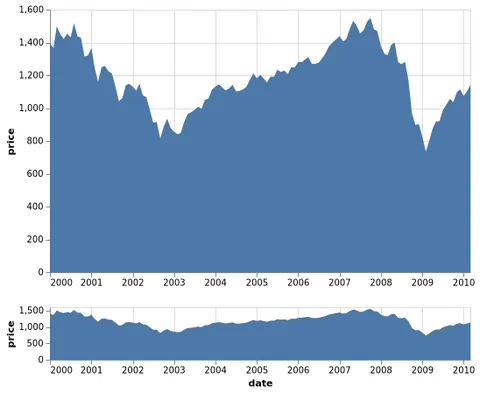 Overview and Detail Open in Vega Editor
 -
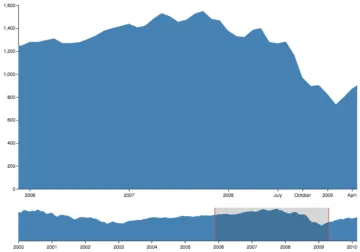 Overview Plus Detail Open in Vega Editor
 -
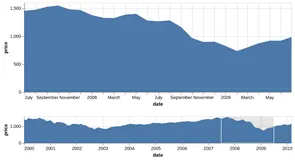 Interval Selection with Initial Date Range Python Source
Vega and Vega-Lite examples open in the Editor with this dataset loaded. Altair examples link to their Python source.
Provenance
- Source
-
No source recorded.
- License
-
Not specified. Check the source's terms before reuse.
- File
data/sp500.csv· 2,305 bytes · View on GitHub