seattle_weather_hourly_normals
Seattle hourly climate normals for 1981–2010
Hourly weather normals with metric units. The 1981-2010 Climate Normals are NCDC's three-decade averages of climatological variables, including temperature and precipitation. Learn more in the documentation. We only included temperature, wind, and pressure and updated the format to be easier to parse.
CSV 8,759 rows 4 fields 311 KB 3 gallery examples 3 examples
Fields
| Field | Type | Distribution | Summary | Missing |
|---|---|---|---|---|
dateAdd a description for date | datetime | Jan 1, 2010, 01:00 AM – Dec 31, 2010, 11:00 PM | Missing 0 | |
pressureAdd a description for pressure | number | 1,015 – 1,020 · mean 1,017 | Missing 0 | |
temperatureAdd a description for temperature | number | 3.1 – 24.4 · mean 11.13 | Missing 0 | |
windAdd a description for wind | number | 2.3 – 4.7 · mean 3.6 | Missing 0 |
Profiled across all 8,759 rows. No field descriptions yet. Add them
Explore
Pick two fields. Scroll to zoom, drag to pan. Both fields have values in 8,759 of 8,759 rows.Pick two fields. Both fields have values in 8,759 of 8,759 rows. Vega-Lite · input binding · scale bindingVega-Lite · input binding
Open This Chart in the Vega Editor Preview
| date | pressure | temperature | wind |
|---|---|---|---|
| 2010-01-01T01:00:00 | 1016.6 | 4.0 | 3.8 |
| 2010-01-01T02:00:00 | 1016.6 | 3.9 | 3.8 |
| 2010-01-01T03:00:00 | 1016.7 | 3.8 | 3.8 |
| 2010-01-01T04:00:00 | 1016.7 | 3.8 | 3.7 |
| 2010-01-01T05:00:00 | 1016.5 | 3.7 | 3.8 |
Examples
-
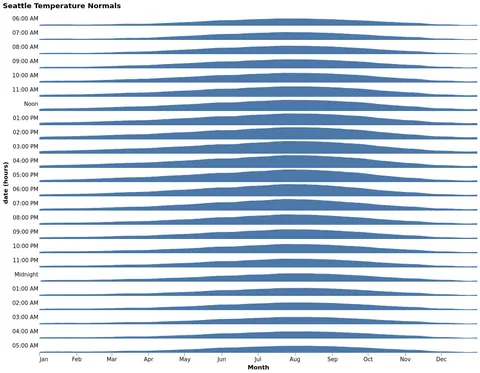 Trellis Area Plot Showing Annual Temperatures in Seattle Open in Vega Editor
 -
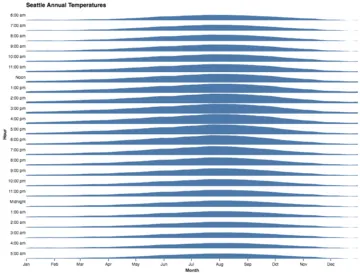 Annual Temperature Open in Vega Editor
 -
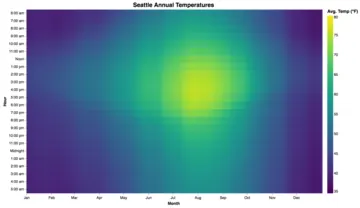 Heatmap Open in Vega Editor
Vega and Vega-Lite examples open in the Editor with this dataset loaded. Altair examples link to their Python source.
Provenance
- Source
- License
-
- U.S. Government Dataset (other-pd)
- File
data/seattle-weather-hourly-normals.csv· 311,148 bytes · View on GitHub