seattle_weather
Seattle daily weather from 2012–2015
Daily weather in metric units. Transformed using /scripts/weather.py.
The categorical "weather" field is synthesized from multiple fields in the original dataset.
This data is intended for instructional purposes.
CSV 1,461 rows 6 fields 48 KB 22 gallery examples 22 examples
Fields
| Field | Type | Distribution | Summary | Missing |
|---|---|---|---|---|
dateDate of the weather observation | date | Jan 1, 2012 – Dec 31, 2015 | Missing 0 | |
precipitationAmount of precipitation in millimeters | number | 0 – 55.9 · mean 3.03 | Missing 0 | |
temp_maxMaximum daily temperature in degrees Celsius | number | -1.6 – 35.6 · mean 16.44 | Missing 0 | |
temp_minMinimum daily temperature in degrees Celsius | number | -7.1 – 18.3 · mean 8.24 | Missing 0 | |
windWind speed in kilometers per hour | number | 0.4 – 9.5 · mean 3.24 | Missing 0 | |
weatherCategorical weather type synthesized from original NOAA data fields. Categories include: drizzle, rain, snow, sun, and fog. | string | 5 distinct | rain 641 · sun 640 · fog 101 | Missing 0 |
Profiled across all 1,461 rows.
Explore
Pick two fields. Scroll to zoom, drag to pan. Click the legend to isolate a weather. Both fields have values in 1,461 of 1,461 rows.Pick two fields. Tap the legend to isolate a weather. Both fields have values in 1,461 of 1,461 rows. Vega-Lite · input binding · scale binding · legend bindingVega-Lite · input binding · legend binding
Open This Chart in the Vega Editor Preview
| date | precipitation | temp_max | temp_min | wind | weather |
|---|---|---|---|---|---|
| 2012-01-01 | 0.0 | 12.8 | 5.0 | 4.7 | drizzle |
| 2012-01-02 | 10.9 | 10.6 | 2.8 | 4.5 | rain |
| 2012-01-03 | 0.8 | 11.7 | 7.2 | 2.3 | rain |
| 2012-01-04 | 20.3 | 12.2 | 5.6 | 4.7 | rain |
| 2012-01-05 | 1.3 | 8.9 | 2.8 | 6.1 | rain |
Scroll sideways for all 6 fields.
Examples
-
 1D Strip Plot Open in Vega Editor
 -
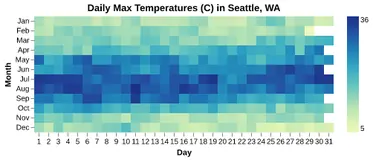 Annual Weather Heatmap Python Source
 -
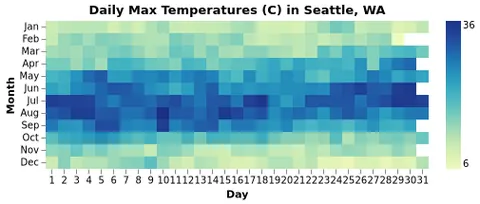 Annual Weather Heatmap Open in Vega Editor
 -
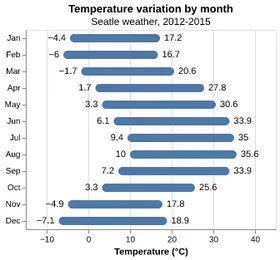 Bar Chart with Range Python Source
 -
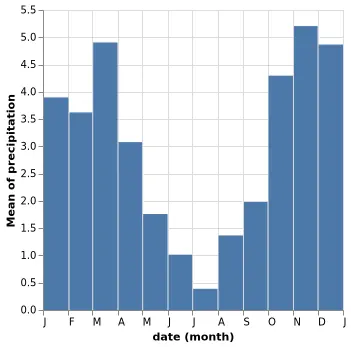 Bar Chart showing Initials of Month Names Open in Vega Editor
 -
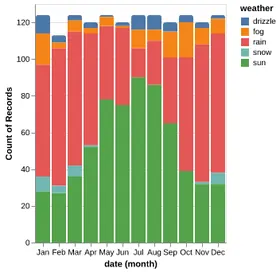 Bar Chart with Rounded Edges Python Source
 -
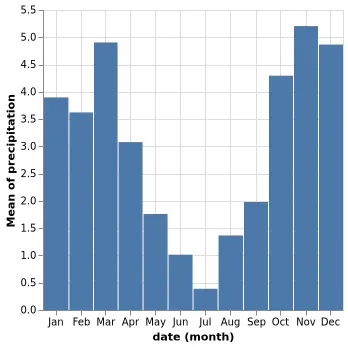 Bar Chart with bars center-aligned with time unit ticks Open in Vega Editor
 -
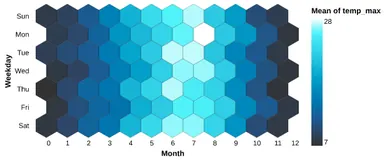 Hexbin Chart Python Source
 -
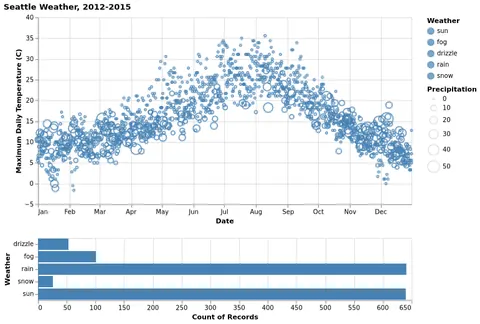 Dynamic Color Legend Open in Vega Editor
 -
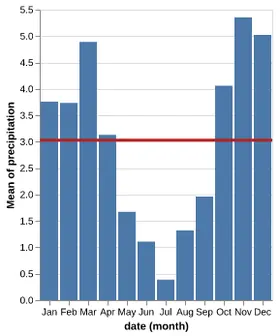 Interactive Average Python Source
 -
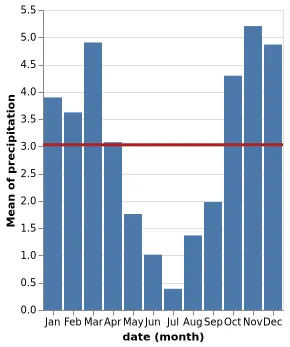 Interactive Average Open in Vega Editor
 -
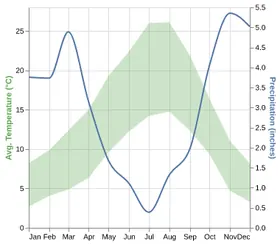 Layered chart with Dual-Axis Python Source
 -
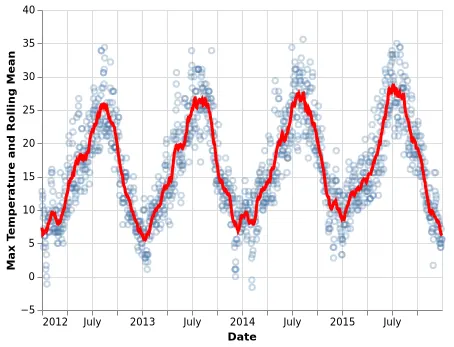 Layering Rolling Averages over Raw Values Open in Vega Editor
 -
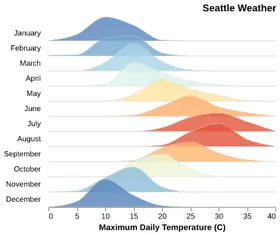 Ridgeline plot Python Source
 -
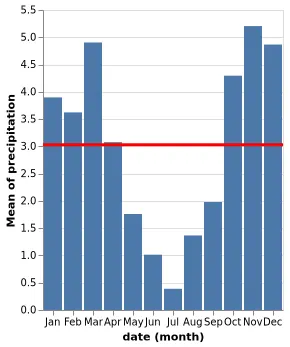 Mean overlay over precipitation chart Open in Vega Editor
 -
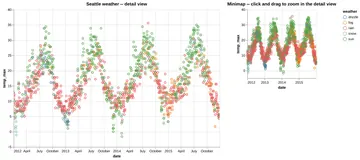 Scatter Plot with Minimap Python Source
 -
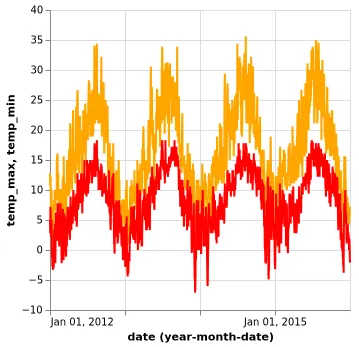 Multi Series Line Chart with Tooltip Open in Vega Editor
 -
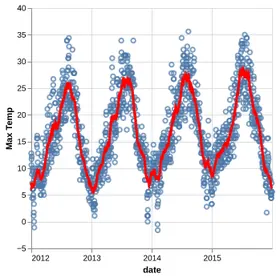 Scatter Plot with Rolling Mean Python Source
 -
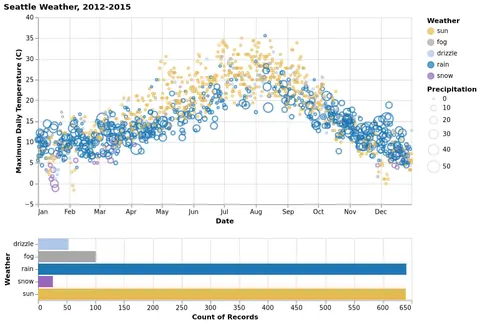 Seattle Weather Exploration Open in Vega Editor
 -
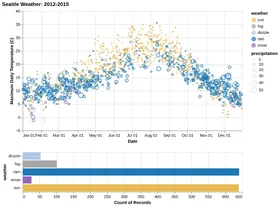 Seattle Weather Interactive Python Source
 -
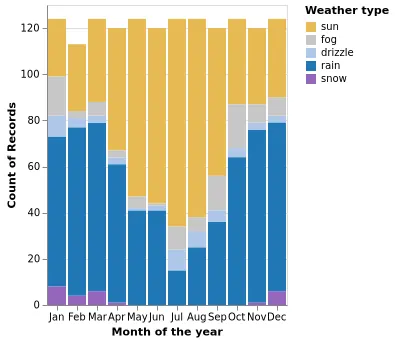 Stacked Bar Chart Open in Vega Editor
 -
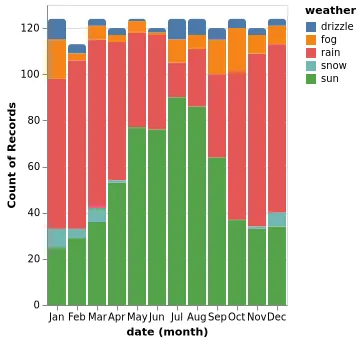 Stacked Bar Chart with Rounded Corners Open in Vega Editor
Vega and Vega-Lite examples open in the Editor with this dataset loaded. Altair examples link to their Python source.
Provenance
- Source
- License
-
- U.S. Government Dataset (other-pd)
- File
data/seattle-weather.csv· 48,219 bytes · View on GitHub