population_engineers_hurricanes
U.S. population, engineering employment and hurricane landfalls
Per-state population (2016 ACS 1-Year), ratio of engineers to total civilian employed population (2016 ACS 1-Year), and total hurricane landfalls (possibly 1851-2015). Used in Vega-Lite example, Three Choropleths Representing Disjoint Data from the Same Table
CSV 52 rows 5 fields 1.9 KB 2 gallery examples 2 examples
Fields
| Field | Type | Distribution | Summary | Missing |
|---|---|---|---|---|
stateAdd a description for state | string | 52 distinct | Alabama 1 · Alaska 1 · Arizona 1 | Missing 0 |
idAdd a description for id | integer | 1 – 72 · mean 29.79 | Missing 0 | |
populationAdd a description for population | integer | 585,500 – 39,250,000 · mean 6,280,000 | Missing 0 | |
engineersAdd a description for engineers | number | 0.001 – 0.012 · mean 0.004 | Missing 0 | |
hurricanesAdd a description for hurricanes | integer | 0 – 110 · mean 8.08 | Missing 0 |
Profiled across all 52 rows. No field descriptions yet. Add them
Explore
Pick two fields. Scroll to zoom, drag to pan. Both fields have values in 52 of 52 rows.Pick two fields. Both fields have values in 52 of 52 rows. Vega-Lite · input binding · scale bindingVega-Lite · input binding
Open This Chart in the Vega Editor Preview
| state | id | population | engineers | hurricanes |
|---|---|---|---|---|
| Alabama | 1 | 4863300 | 0.003421545 | 22 |
| Alaska | 2 | 741894 | 0.001590524 | 0 |
| Arizona | 4 | 6931071 | 0.004774154 | 0 |
| Arkansas | 5 | 2988248 | 0.002439557 | 0 |
| California | 6 | 39250017 | 0.007125857 | 0 |
Scroll sideways for all 5 fields.
Examples
-
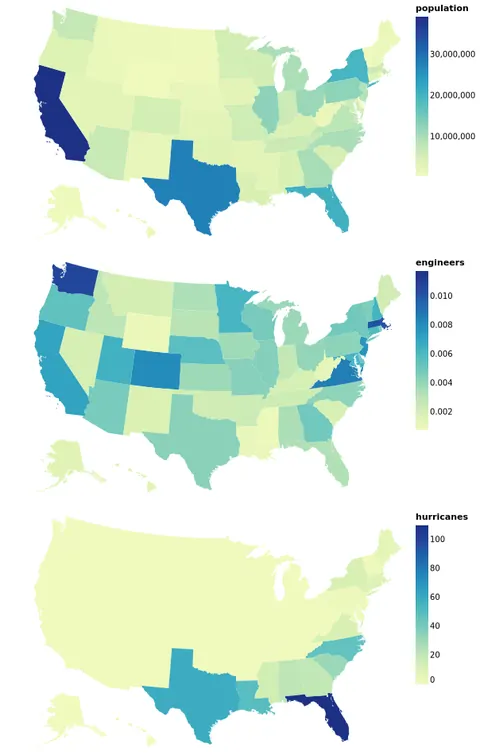 Three Choropleths Representing Disjoint Data from the Same Table Open in Vega Editor
 -
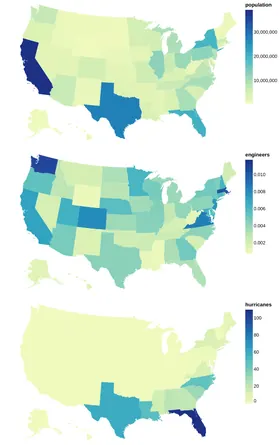 Repeated Choropleth Map Python Source
Vega and Vega-Lite examples open in the Editor with this dataset loaded. Altair examples link to their Python source.
Provenance
- Source
- License
-
- U.S. Government Dataset (other-pd)
- File
data/population_engineers_hurricanes.csv· 1,852 bytes · View on GitHub