population
U.S. population by age, sex and census year
U.S. population counts by age group (0-90+ in 5-year intervals) and sex for each decade between 1850 and 2000, collected and harmonized from historical census records by IPUMS USA.
IPUMS updates and revises datasets over time, which may result in discrepancies with current IPUMS data.
When using this dataset, please refer to IPUMS USA terms of use. The organization requests the use of the following citation for this json file: Steven Ruggles, Katie Genadek, Ronald Goeken, Josiah Grover, and Matthew Sobek. Integrated Public Use Microdata Series: Version 6.0. Minneapolis: University of Minnesota, 2015. http://doi.org/10.18128/D010.V6.0
Fields
| Field | Type | Distribution | Summary | Missing |
|---|---|---|---|---|
yearFour-digit year of the survey | integer | 1,850 – 2,000 · mean 1,927 | Missing 0 | |
ageAge group in 5-year intervals (0=0-4, 5=5-9, 10=10-14, ..., 90=90+) | integer | 0 – 90 · mean 45 | Missing 0 | |
sexSex (1=men, 2=women) | integer | 1 – 2 · mean 1.5 | Missing 0 | |
peopleNumber of individuals (IPUMS PERWT) | integer | 5,259 – 11,640,000 · mean 3,429,000 | Missing 0 |
Profiled across all 570 rows.
Explore
Preview
| year | age | sex | people |
|---|---|---|---|
| 1850 | 0 | 1 | 1483789 |
| 1850 | 0 | 2 | 1450376 |
| 1850 | 5 | 1 | 1411067 |
| 1850 | 5 | 2 | 1359668 |
| 1850 | 10 | 1 | 1260099 |
Examples
-
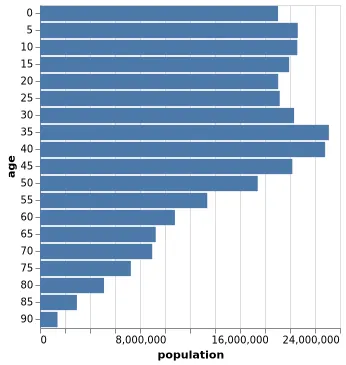 Aggregate Bar Chart Open in Vega Editor
 -
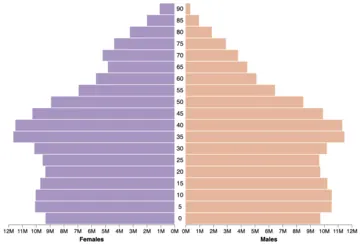 Population Pyramid Open in Vega Editor
 -
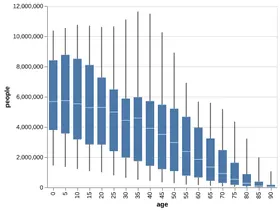 Boxplot with Min/Max Whiskers Python Source
 -
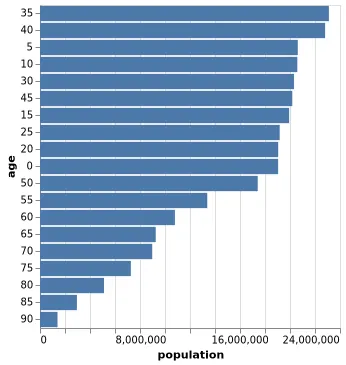 Aggregate Bar Chart (Sorted) Open in Vega Editor
 -
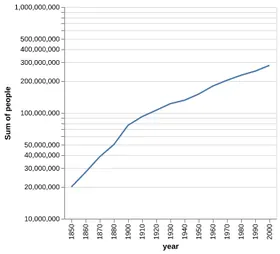 Line Chart with Logarithmic Scale Python Source
 -
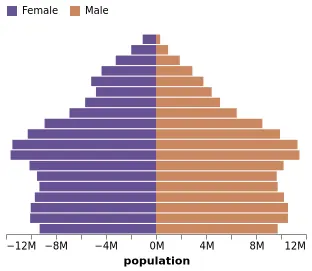 Diverging Stacked Bar Chart (Population Pyramid) Open in Vega Editor
 -
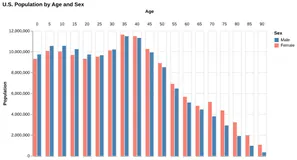 US Population by Age and Sex Python Source
 -
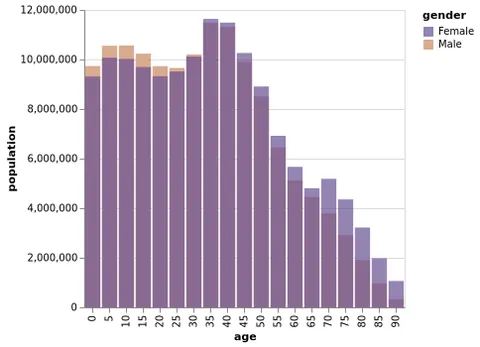 Layered Bar Chart Open in Vega Editor
 -
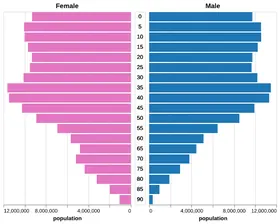 US Population Pyramid Over Time Python Source
 -
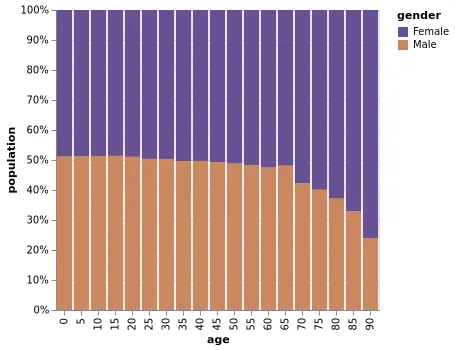 Normalized (Percentage) Stacked Bar Chart Open in Vega Editor
 -
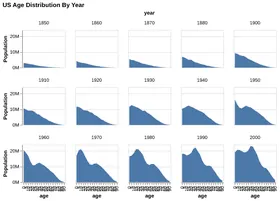 US Population: Wrapped Facet Python Source
 -
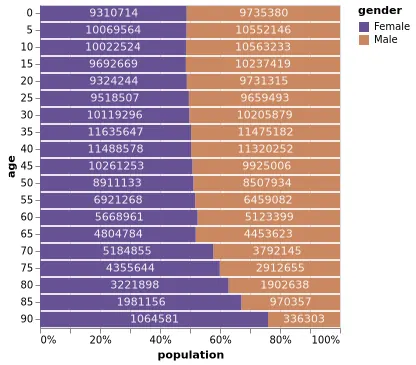 Normalized (Percentage) Stacked Bar Chart With Labels Open in Vega Editor
 -
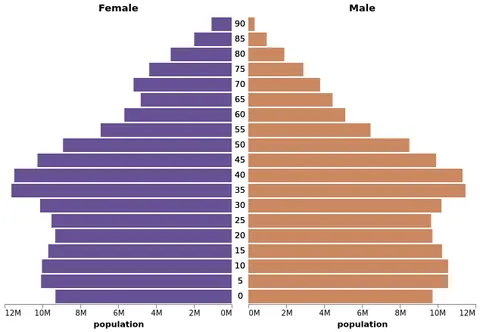 Population Pyramid Open in Vega Editor
 -
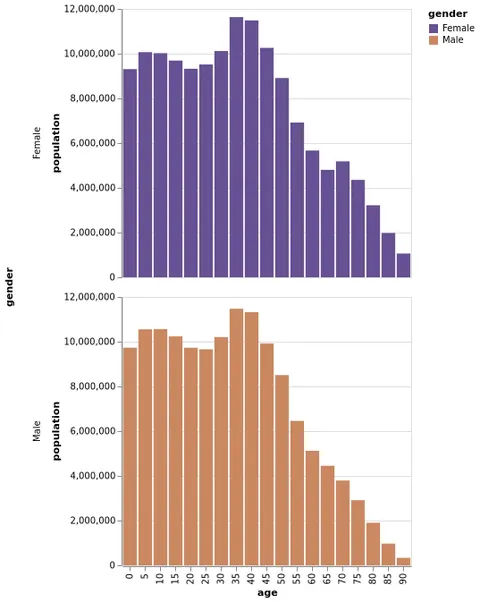 Trellis Bar Chart Open in Vega Editor
Vega and Vega-Lite examples open in the Editor with this dataset loaded. Altair examples link to their Python source.
Provenance
- Source
- License
-
Not specified. IPUMS Terms of Use (www.ipums.org). Check the source's terms before reuse.
- File
data/population.json· 27,665 bytes · View on GitHub