budgets
U.S. federal budget balances and forecasts
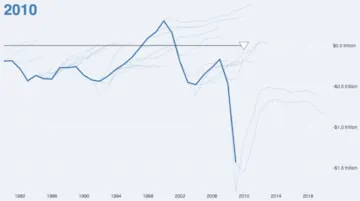
U.S. federal budget projections and actual outcomes from 1980 through 2010. Originally analyzed by The New York Times in 2010. Reveals how budget forecasts made in any given year compared to what actually happened, with positive values indicating surpluses (briefly seen around 2000) and negative values representing deficits (reaching a particularly large value of -$1.78 trillion during the 2008-2009 financial crisis).
Fields
| Field | Type | Distribution | Summary | Missing |
|---|---|---|---|---|
budgetYearThe year for which the budget outcome is being reported | integer | 1,980 – 2,010 · mean 1,997 | Missing 0 | |
forecastYearThe year for which the budget was forecast | integer | 1,980 – 2,020 · mean 1,999 | Missing 0 | |
valueThe budget outcome or projection value (in trillions of 2010 dollars) | number | -1.78 – 0.519 · mean -0.194 | Missing 0 |
Profiled across all 230 rows.
Explore
Preview
| budgetYear | forecastYear | value |
|---|---|---|
| 1980 | 1980 | -0.103 |
| 1980 | 1981 | -0.037 |
| 1980 | 1982 | 0.01 |
| 1980 | 1983 | 0.051 |
| 1981 | 1980 | -0.192 |
Examples
Vega and Vega-Lite examples open in the Editor with this dataset loaded. Altair examples link to their Python source.
Provenance
- Source
- License
-
- U.S. Government Dataset (other-pd)
- File
data/budgets.json· 18,079 bytes · View on GitHub