bird_migration
Daily bird migration population centers
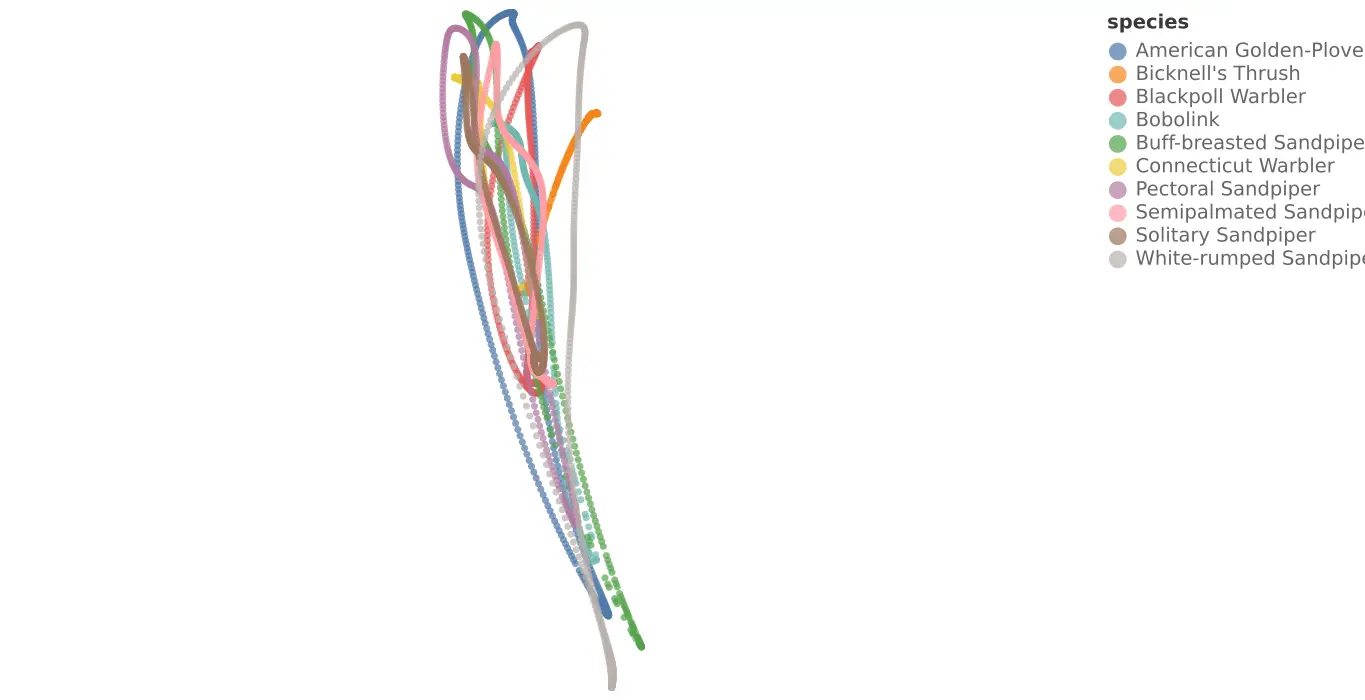
Daily migration trajectories for ten bird species that breed in North America and cross the Atlantic Ocean during autumn migration. Each row gives the geographic center of one species' population on one day of the year, estimated from eBird occurrence records collected between 1950 and 2015. Tracing a species across the year traces its annual migration: American Golden-Plover begins January on the Argentine pampas, reaches 70°N by late June, and returns.
Because the estimates average many years, no calendar year applies to them. Following
seattle-weather-hourly-normals.csv, the date column uses a nominal non-leap year, and day
holds the day of the year alongside it.
Transformed using /scripts/bird-migration.py, which downloads the source from Dryad's official
Zenodo mirror and verifies its SHA-256 before conversion. It derives the day from row order within each
species, drops the 421 of 3650 source rows whose coordinates are NA, and rounds coordinates to
four decimal places. Days with no estimate concentrate in the non-breeding season, when eBird
coverage of South America and the Caribbean was sparse, so a species' day values are not
contiguous: Connecticut Warbler is missing 172 days and Bicknell's Thrush 104, while Semipalmated
Sandpiper, Solitary Sandpiper, and White-rumped Sandpiper are complete.
Fields
| Field | Type | Distribution | Summary | Missing |
|---|---|---|---|---|
speciesCommon name of the bird species | string | 10 distinct | Semipalmated Sandpiper 365 · Solitary Sandpiper 365 · White-rumped Sandpiper 365 | Missing 0 |
dayDay of the year, from 1 for January 1 to 365 for December 31 | integer | 1 – 365 · mean 187.8 | Missing 0 | |
dateThe same day as `day`, carrying a nominal year for use with temporal scales | date | Jan 1, 2015 – Dec 31, 2015 | Missing 0 | |
lonLongitude of the population center, in degrees east | number | -121.6 – -52.3 · mean -79.17 | Missing 0 | |
latLatitude of the population center, in degrees north | number | -43.26 – 70.17 · mean 25.53 | Missing 0 |
Profiled across all 3,229 rows.
Explore
Preview
| species | day | date | lon | lat |
|---|---|---|---|---|
| American Golden-Plover | 1 | 2015-01-01 | -58.019 | -31.0456 |
| American Golden-Plover | 2 | 2015-01-02 | -58.0406 | -31.096 |
| American Golden-Plover | 3 | 2015-01-03 | -58.07 | -31.129 |
| American Golden-Plover | 4 | 2015-01-04 | -58.1073 | -31.1447 |
| American Golden-Plover | 5 | 2015-01-05 | -58.1524 | -31.1432 |
Scroll sideways for all 5 fields.
Examples
Not yet seen in any gallery.
This dataset is published and documented but no Vega, Vega-Lite or Altair example uses it. A new example would be a welcome contribution.
Provenance
- Source
-
- Data from: Projected changes in prevailing winds for transatlantic migratory birds under global warming (La Sorte & Fink, Dryad)
- La Sorte, F.A. & Fink, D. (2017). Projected changes in prevailing winds for transatlantic migratory birds under global warming. Journal of Animal Ecology, 86(2), 273-284
- eBird, Cornell Lab of Ornithology (upstream occurrence records, 1950-2015)
- eBird Data Access Terms of Use (upstream occurrence records)
- License
-
- Creative Commons Zero v1.0 Universal (CC0-1.0)
- File
data/bird-migration.csv· 165,944 bytes · View on GitHub