barley
Minnesota barley yields by variety and trial site
Yields of barley varieties from experiments conducted by the Minnesota Agricultural Experiment Station (MAES) across six sites in Minnesota. The USDA Technical Bulletin No. 735 (December 1940) republished these yields data with explicit credit to MAES as the source.
It was analyzed by agronomists F.R. Immer, H.K. Hayes, and L. Powers in the 1934 paper "Statistical Determination of Barley Varietal Adaption".
R.A. Fisher popularized its use in the field of statistics when he included it in his book "The Design of Experiments".
Since then it has been used to demonstrate new visualization techniques, including the trellis charts developed by Richard Becker, William Cleveland and others in the 1990s.
Fields
| Field | Type | Distribution | Summary | Missing |
|---|---|---|---|---|
yieldAdd a description for yield | number | 14.43 – 65.77 · mean 34.42 | Missing 0 | |
varietyAdd a description for variety | string | 10 distinct | Glabron 12 · Manchuria 12 · No. 457 12 | Missing 0 |
yearAdd a description for year | integer | 1,931 – 1,932 · mean 1,932 | Missing 0 | |
siteAdd a description for site | string | 6 distinct | Crookston 20 · Duluth 20 · Grand Rapids 20 | Missing 0 |
Profiled across all 120 rows. No field descriptions yet. Add them
Explore
Preview
| yield | variety | year | site |
|---|---|---|---|
| 27 | Manchuria | 1931 | University Farm |
| 48.86667 | Manchuria | 1931 | Waseca |
| 27.43334 | Manchuria | 1931 | Morris |
| 39.93333 | Manchuria | 1931 | Crookston |
| 32.96667 | Manchuria | 1931 | Grand Rapids |
Examples
-
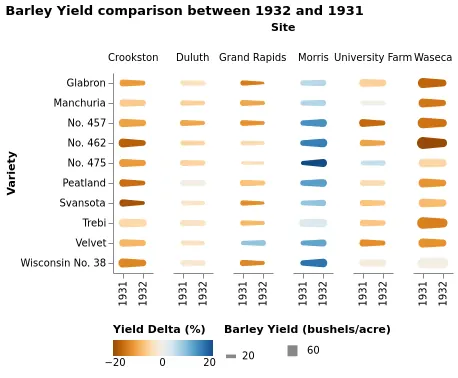 A comet chart showing changes between between two states Open in Vega Editor
 -
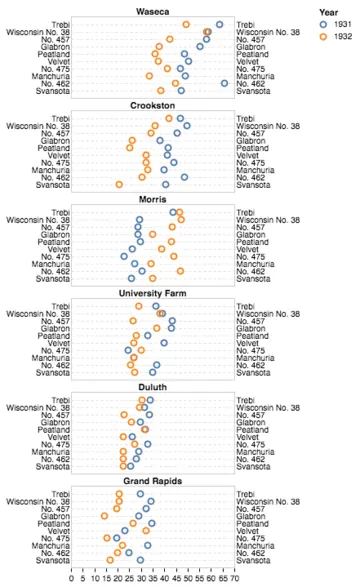 Barley Trellis Plot Open in Vega Editor
 -
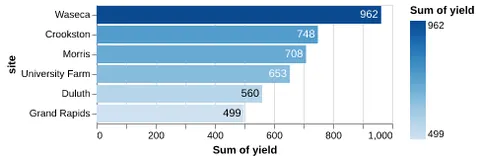 Bar Chart with Labels based on Measured Luminance Python Source
 -
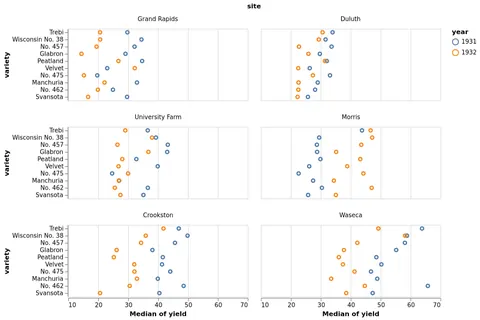 Becker's Barley Trellis Plot Open in Vega Editor
 -
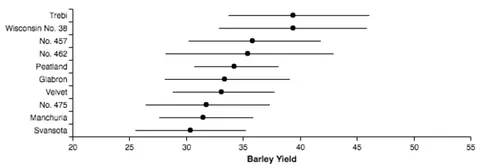 Error Bars Open in Vega Editor
 -
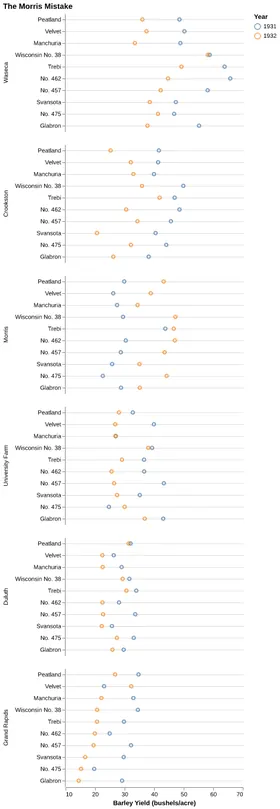 Becker's Barley Faceted Plot Python Source
 -
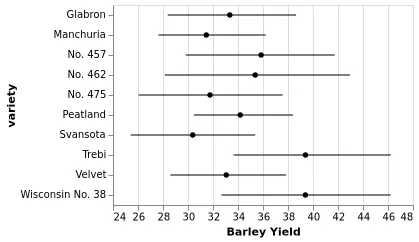 Error Bars Showing Confidence Interval Open in Vega Editor
 -
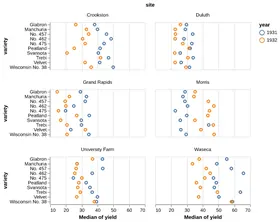 Becker's Barley Wrapped Facet Plot Python Source
 -
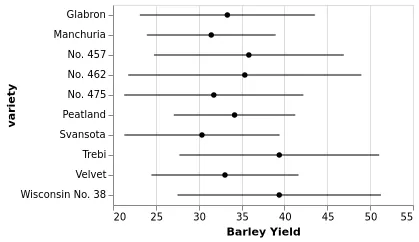 Error Bars Showing Standard Deviation Open in Vega Editor
 -
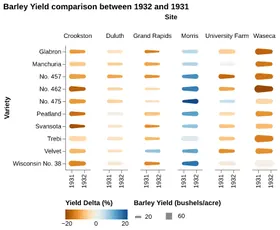 Comet Chart Python Source
 -
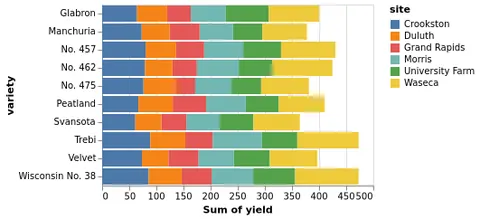 Horizontal Stacked Bar Chart Open in Vega Editor
 -
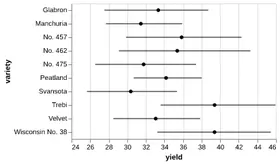 Error Bars with Confidence Interval Python Source
 -
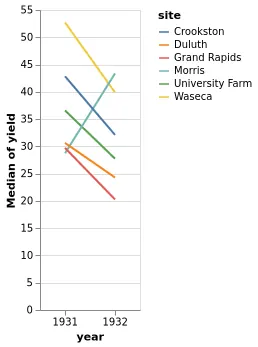 Slope Graph Open in Vega Editor
 -
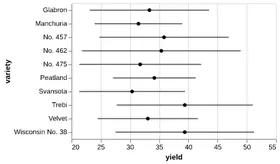 Error Bars with Standard Deviation Python Source
 -
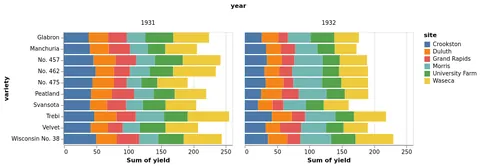 Trellis Stacked Bar Chart Open in Vega Editor
 -
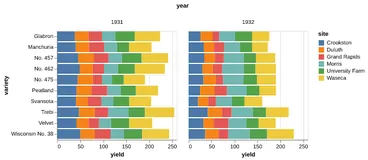 Faceted Stacked Bar Chart Python Source
 -
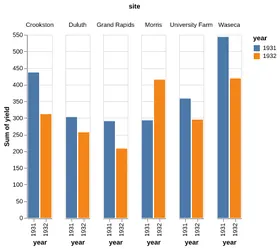 Grouped Bar Chart Python Source
 -
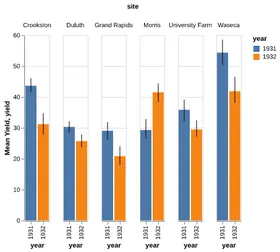 Grouped Bar Chart with Error Bars Python Source
 -
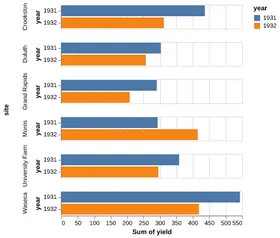 Horizontal Grouped Bar Chart Python Source
 -
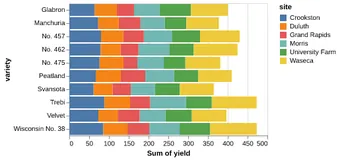 Horizontal Stacked Bar Chart Python Source
 -
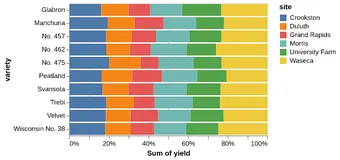 Normalized Stacked Bar Chart Python Source
 -
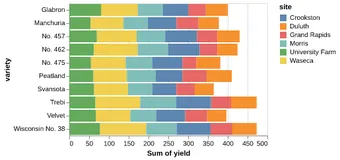 Reorder stacked bar segments Python Source
 -
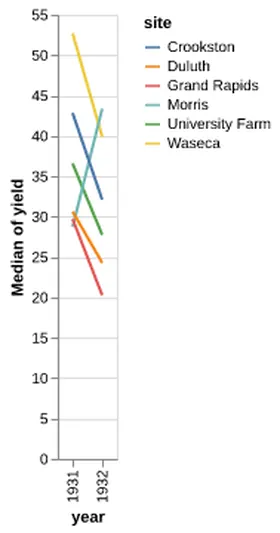 Slope Graph Python Source
 -
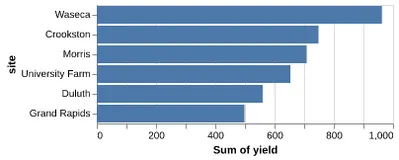 Sorted Bar Chart Python Source
 -
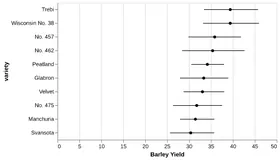 Sorted Error Bars showing Confidence Interval Python Source
 -
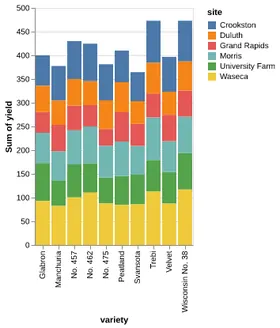 Stacked Bar Chart Python Source
 -
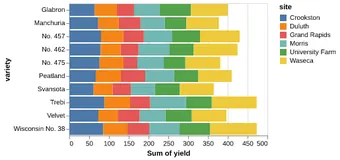 Stacked Bar Chart with Sorted Segments Python Source
 -
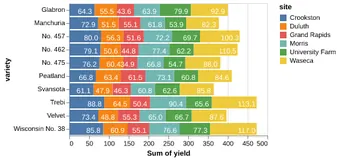 Stacked Bar Chart with Text Overlay Python Source
Vega and Vega-Lite examples open in the Editor with this dataset loaded. Altair examples link to their Python source.
Provenance
- Source
- License
-
Not specified. Dataset collected by Minnesota Agricultural Experiment Station - license status unspecified. Check the source's terms before reuse.
- File
data/barley.json· 8,487 bytes · View on GitHub