Quick Start#
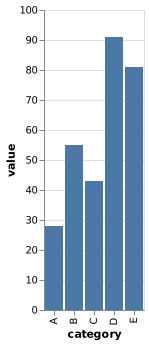
This example renders a small Vega-Lite bar chart with inline data as chart.png. See Loading Data and Images for configuration options when a chart loads data from a URL or file.
Save this specification:
chart.vl.json
{
  "$schema": "https://vega.github.io/schema/vega-lite/v6.json",
  "data": {
    "values": [
      {"category": "A", "value": 28},
      {"category": "B", "value": 55},
      {"category": "C", "value": 43},
      {"category": "D", "value": 91},
      {"category": "E", "value": 81}
    ]
  },
  "mark": "bar",
  "encoding": {
    "x": {"field": "category", "type": "nominal"},
    "y": {"field": "value", "type": "quantitative"}
  }
}
Render it at twice the default pixel dimensions:
$ vl-convert vl2png --input chart.vl.json --output chart.png --scale 2
Conversion commands can also read standard input and write standard output:
$ vl-convert vl2png --input - --output - < chart.vl.json > chart.png
See Converting from Vega-Lite for the other supported output formats and Standard Input and Output for details on pipeline usage.
The specification renders as this chart: