stocks
Monthly stock prices for five companies
Monthly stock prices for five companies from 2000 to 2010.
CSV 560 rows 3 fields 12 KB 36 gallery examples 36 examples License not specified
Fields
| Field | Type | Distribution | Summary | Missing |
|---|---|---|---|---|
symbolAdd a description for symbol | string | 5 distinct | AAPL 123 · AMZN 123 · IBM 123 | Missing 0 |
dateAdd a description for date | date%b %d %Y | Jan 1, 2000 – Mar 1, 2010 | Missing 0 | |
priceAdd a description for price | number | 5.97 – 707 · mean 100.7 | Missing 0 |
Profiled across all 560 rows. No field descriptions yet. Add them
Explore
Vega-Lite · line mark · mean aggregate · tooltipVega-Lite · line mark · mean aggregate · tooltip
Open This Chart in the Vega Editor Preview
| symbol | date | price |
|---|---|---|
| MSFT | Jan 1 2000 | 39.81 |
| MSFT | Feb 1 2000 | 36.35 |
| MSFT | Mar 1 2000 | 43.22 |
| MSFT | Apr 1 2000 | 28.37 |
| MSFT | May 1 2000 | 25.45 |
Examples
-
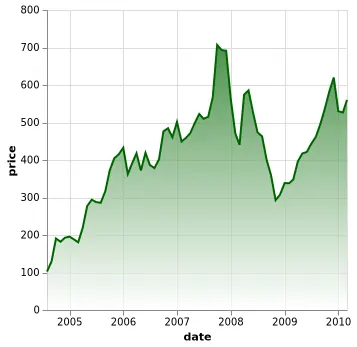 Area Chart with Gradient Open in Vega Editor
 -
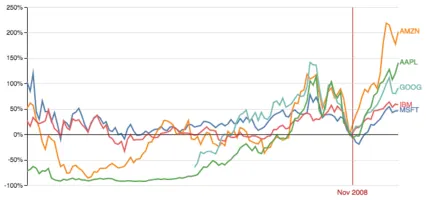 Stock Index Chart Open in Vega Editor
 -
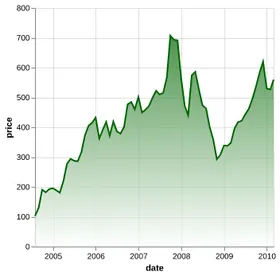 Area Chart with Gradient Python Source
 -
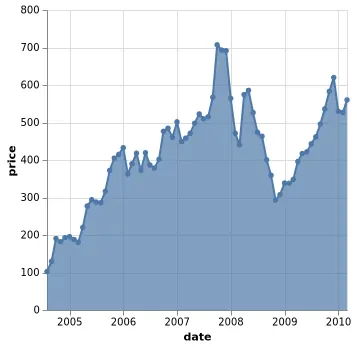 Area Chart with Overlaying Lines and Point Markers Open in Vega Editor
 -
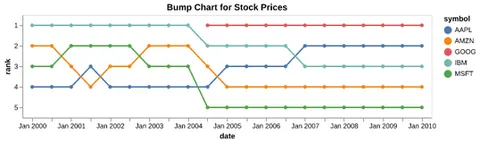 Bump Chart Python Source
 -
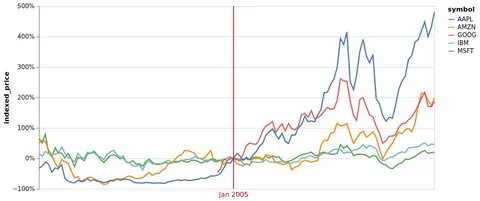 Interactive Index Chart Open in Vega Editor
 -
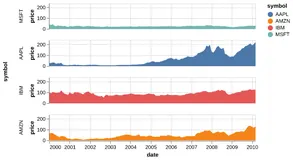 Faceted Area Chart Python Source
 -
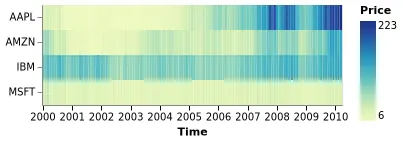 Lasagna Plot (Dense Time-Series Heatmap) Open in Vega Editor
 -
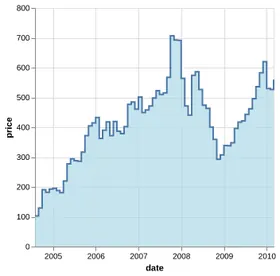 Filled Step Chart Python Source
 -
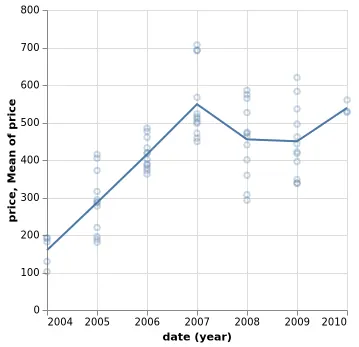 Layering Averages over Raw Values Open in Vega Editor
 -
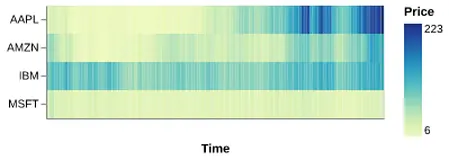 Lasagna Plot (Dense Time-Series Heatmap) Python Source
 -
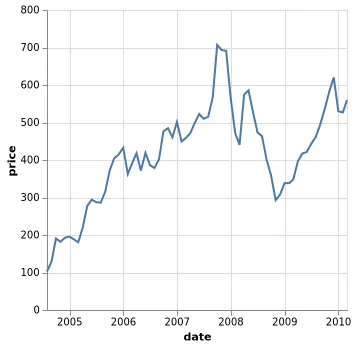 Line Chart Open in Vega Editor
 -
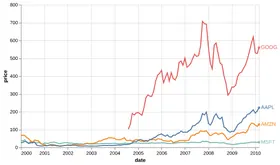 Line Chart with Custom Legend Python Source
 -
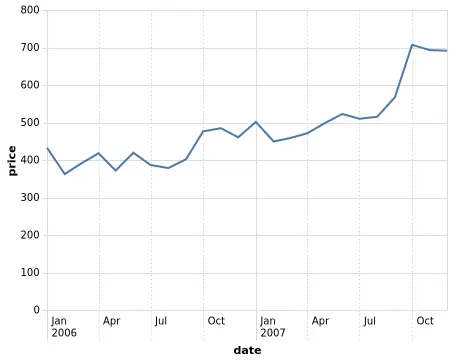 Line Chart with Conditional Axis Properties Open in Vega Editor
 -
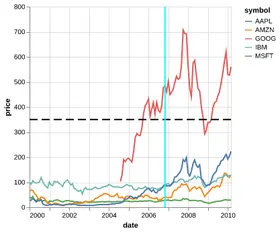 Line Chart with Datum Python Source
 -
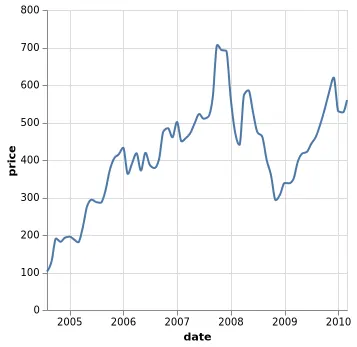 Line Chart with Monotone Interpolation Open in Vega Editor
 -
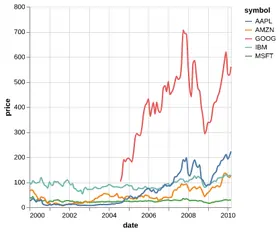 Line Chart with Interpolation Python Source
 -
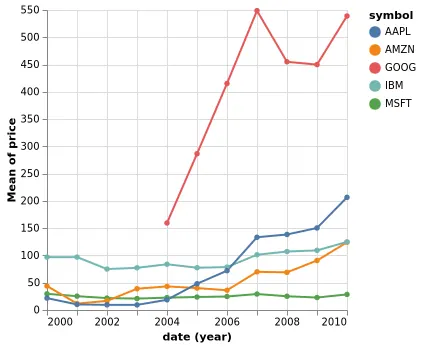 Line Chart with Point Markers Open in Vega Editor
 -
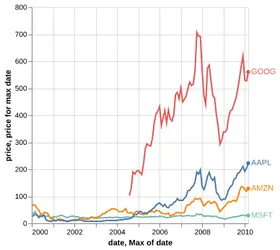 Line Chart with Last Value Labeled Python Source
 -
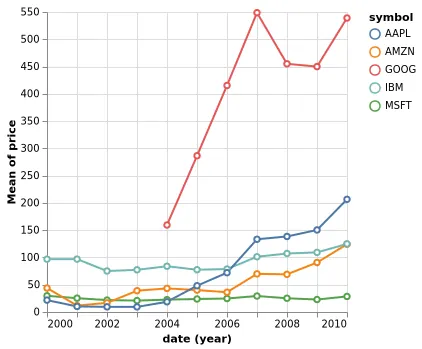 Line Chart with Stroked Point Markers Open in Vega Editor
 -
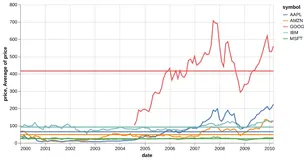 Line Chart with Layered Aggregates Python Source
 -
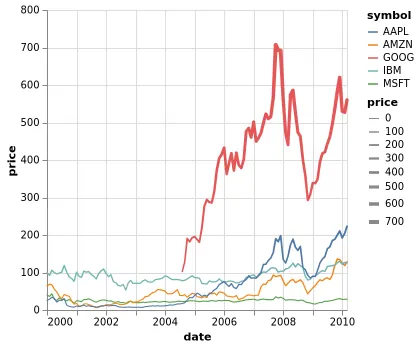 Line Chart with Varying Size (using the trail mark) Open in Vega Editor
 -
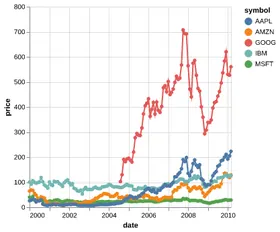 Line Chart with Point Markers Python Source
 -
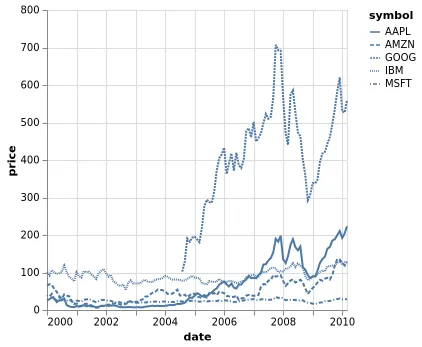 Line chart with varying stroke dash Open in Vega Editor
 -
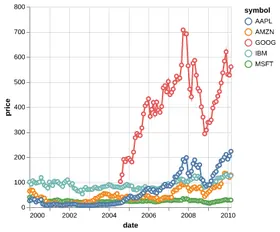 Line Chart with Stroked Point Markers Python Source
 -
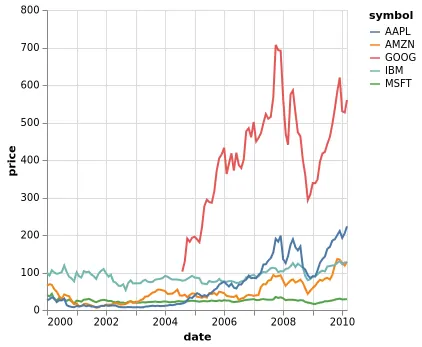 Multi Series Line Chart Open in Vega Editor
 -
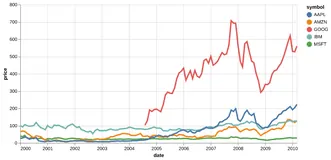 Multi-Line Highlight Python Source
 -
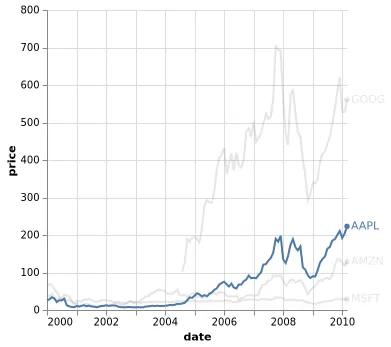 Multi Series Line Chart with an Interactive Line Highlight Open in Vega Editor
 -
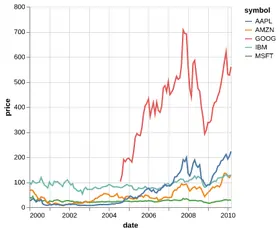 Multiple Series Line Chart Python Source
 -
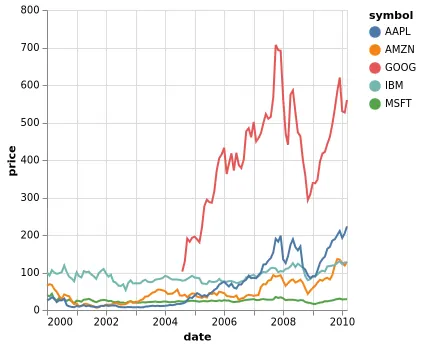 Multi Series Line Chart with an Interactive Point Highlight Open in Vega Editor
 -
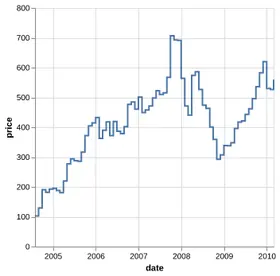 Step Chart Python Source
 -
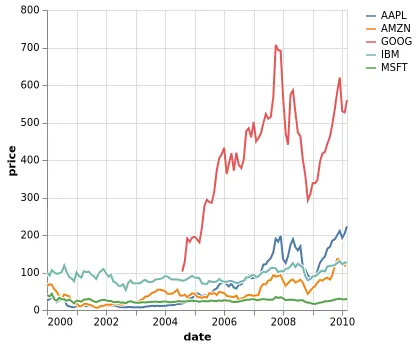 Multi Series Line Chart with Halo Stroke Open in Vega Editor
 -
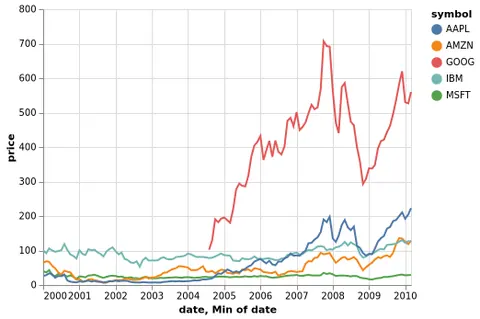 Multi Series Line Chart with Labels Open in Vega Editor
 -
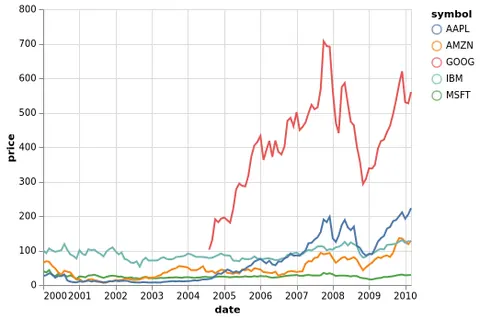 Multi Series Line Chart with Tooltip via Pivot Open in Vega Editor
 -
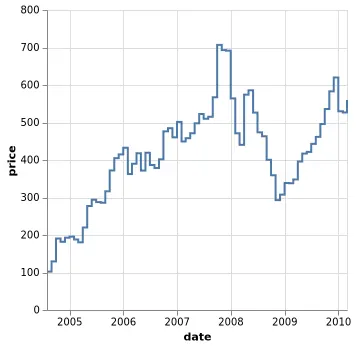 Step Chart Open in Vega Editor
 -
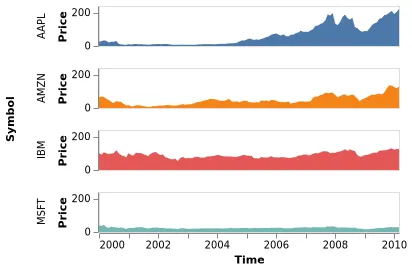 Trellis Area Open in Vega Editor
Vega and Vega-Lite examples open in the Editor with this dataset loaded. Altair examples link to their Python source.
Provenance
- Source
-
No source recorded.
- License
-
Not specified. Check the source's terms before reuse.
- File
data/stocks.csv· 12,245 bytes · View on GitHub