ohlc
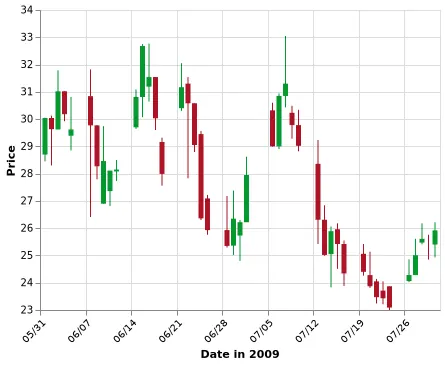
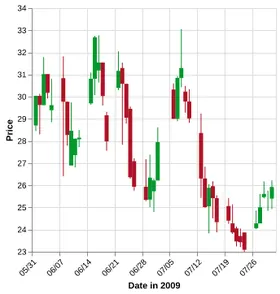
VIX daily open, high, low and close values
Performance of the Chicago Board Options Exchange Volatility Index (VIX) in the summer of 2009.
The precise methodology used to derive the signal and calculate the ret columns is unclear.
JSON 44 rows 7 fields 5.7 KB 2 gallery examples 2 examples License not specified
Fields
| Field | Type | Distribution | Summary | Missing |
|---|---|---|---|---|
dateAdd a description for date | date | Jun 1, 2009 – Jul 31, 2009 | Missing 0 | |
openAdd a description for open | number | 23.71 – 31.54 · mean 27.8 | Missing 0 | |
highAdd a description for high | number | 23.87 – 33.05 · mean 28.64 | Missing 0 | |
lowAdd a description for low | number | 23 – 30.64 · mean 26.79 | Missing 0 | |
closeAdd a description for close | number | 23.09 – 32.68 · mean 27.65 | Missing 0 | |
signalAdd a description for signal | string | 3 distinct | short 24 · long 19 · neutral 1 | Missing 0 |
retAdd a description for ret | number | -10.84 – 15.49 · mean 1.38 | Missing 0 |
Profiled across all 44 rows. No field descriptions yet. Add them
Explore
Pick two fields. Scroll to zoom, drag to pan. Click the legend to isolate a signal. Both fields have values in 44 of 44 rows.Pick two fields. Tap the legend to isolate a signal. Both fields have values in 44 of 44 rows. Vega-Lite · input binding · scale binding · legend bindingVega-Lite · input binding · legend binding
Open This Chart in the Vega Editor Preview
| date | open | high | low | close | signal | ret |
|---|---|---|---|---|---|---|
| 2009-06-01 | 28.7 | 30.05 | 28.45 | 30.04 | short | -4.89396411092985 |
| 2009-06-02 | 30.04 | 30.13 | 28.3 | 29.63 | short | -0.322580645161295 |
| 2009-06-03 | 29.62 | 31.79 | 29.62 | 31.02 | short | 3.68663594470045 |
| 2009-06-04 | 31.02 | 31.02 | 29.92 | 30.18 | short | 4.51010886469673 |
| 2009-06-05 | 29.39 | 30.81 | 28.85 | 29.62 | short | 6.08424336973478 |
Scroll sideways for all 7 fields.
Examples
Vega and Vega-Lite examples open in the Editor with this dataset loaded. Altair examples link to their Python source.
Provenance
- Source
- License
-
Not specified. Check the source's terms before reuse.
- File
data/ohlc.json· 5,737 bytes · View on GitHub