normal_2d
Simulated points from a bivariate normal distribution
Five hundred paired coordinates sampled from a bivariate normal distribution. The data is centered near the
origin with standard deviations indicating a relatively equal spread in both dimensions.
The variables exhibit negligible correlation (0.026), suggesting independence.
Normality tests for each variable yield high p-values, supporting the normal distribution assumption.
These characteristics make it well-suited for demonstrating statistical visualization techniques
in Vega and Vega-Lite, including scatter plots, density plots, heatmaps, and marginal histograms/density curves.
It can also serve as a clean baseline for testing new visualization methods or for educational purposes
in data visualization and statistics.
A contrast to uniformly distributed data in uniform-2d.json
Fields
| Field | Type | Distribution | Summary | Missing |
|---|---|---|---|---|
umean: 0.005, std: 0.192, range: [-0.578, 0.533], p-value: 0.680 | number | -0.578 – 0.533 · mean 0.005 | Missing 0 | |
vmean: -0.011, std: 0.199, range: [-0.534, 0.606], p-value: 0.763 | number | -0.534 – 0.606 · mean -0.011 | Missing 0 |
Profiled across all 500 rows.
Explore
Preview
| u | v |
|---|---|
| -0.1724099452164216 | 0.007374582889590287 |
| 0.19643515250010635 | 0.13236252089007686 |
| -0.05003877259110454 | -0.08910432731027129 |
| -0.11568764038081183 | 0.37888941407245746 |
| 0.2511246354296579 | 0.1009497029056371 |
Examples
-
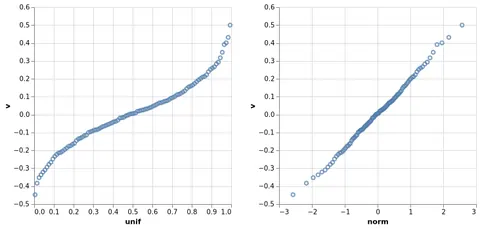 Quantile-Quantile Plot (QQ Plot) Open in Vega Editor
 -
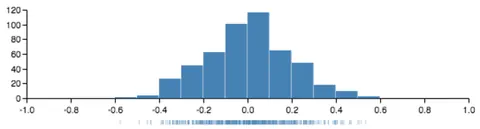 Histogram Open in Vega Editor
 -
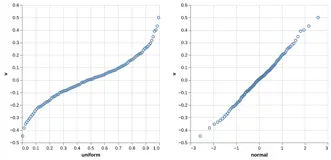 Quantile-Quantile Plot Python Source
 -
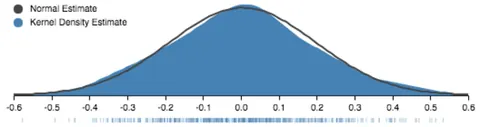 Probability Density Open in Vega Editor
 -
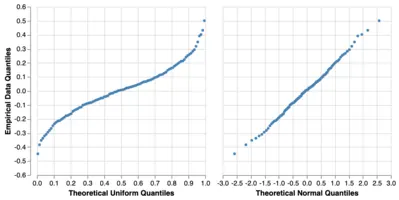 Quantile-Quantile Plot Open in Vega Editor
 -
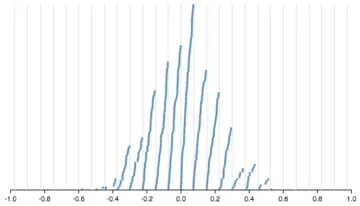 Wheat Plot Open in Vega Editor
 -
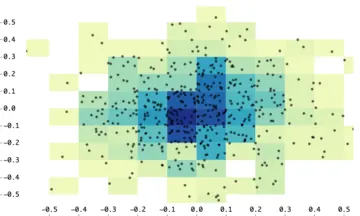 Zoomable Binned Plot Open in Vega Editor
 -
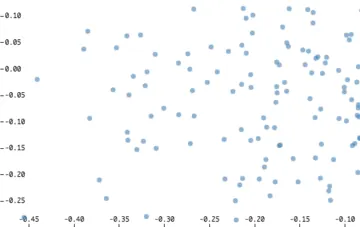 Zoomable Scatter Plot Open in Vega Editor
Vega and Vega-Lite examples open in the Editor with this dataset loaded. Altair examples link to their Python source.
Provenance
- Source
-
- Generated Data
- License
- File
data/normal-2d.json· 34,398 bytes · View on GitHub