london_centroids
London borough centroids including the City of London
Calculated from londonBoroughs.json using d3.geoCentroid.
JSON 33 rows 3 fields 2.3 KB 2 gallery examples 2 examples
Fields
| Field | Type | Distribution | Summary | Missing |
|---|---|---|---|---|
nameAdd a description for name | string | 33 distinct | Barking and Dagenham 1 · Barnet 1 · Bexley 1 | Missing 0 |
cxAdd a description for cx | number | -0.446 – 0.221 · mean -0.12 | Missing 0 | |
cyAdd a description for cy | number | 51.36 – 51.65 · mean 51.5 | Missing 0 |
Profiled across all 33 rows. No field descriptions yet. Add them
Explore
Pick two fields. Scroll to zoom, drag to pan. Both fields have values in 33 of 33 rows.Pick two fields. Both fields have values in 33 of 33 rows. Vega-Lite · input binding · scale bindingVega-Lite · input binding
Open This Chart in the Vega Editor Preview
| name | cx | cy |
|---|---|---|
| Kingston upon Thames | -0.28691465719243003 | 51.387893353778395 |
| Croydon | -0.08716546101532906 | 51.355317416374 |
| Bromley | 0.051536586180461884 | 51.37198402033694 |
| Hounslow | -0.3671516396902454 | 51.46838045919461 |
| Ealing | -0.331019323573572 | 51.52247610268018 |
Examples
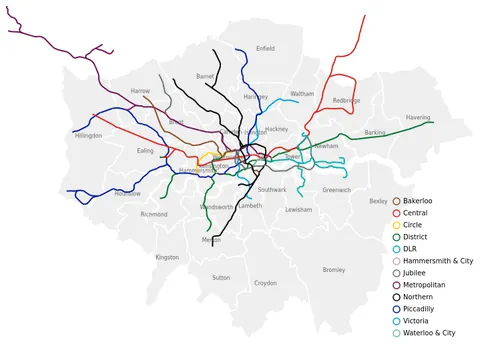
Vega and Vega-Lite examples open in the Editor with this dataset loaded. Altair examples link to their Python source.
Provenance
- Source
- License
-
- UK Open Government License (OGL-UK-3.0)
- File
data/londonCentroids.json· 2,339 bytes · View on GitHub