gapminder
Gapminder population, life expectancy and fertility
Combines key demographic indicators (life expectancy at birth, population, and fertility rate measured as babies per woman) for various countries from 1955 to 2005 at 5-year intervals. Includes a 'cluster' column, a categorical variable grouping countries. Gapminder's data documentation notes that its philosophy is to fill data gaps with estimates and use current geographic boundaries for historical data. Gapminder states that it aims to "show people the big picture" rather than support detailed numeric analysis.
Notes:
Country Selection: The set of countries matches the version of this dataset originally added to this collection in 2015. The specific criteria for country selection in that version are not known. Data for Aruba are no longer available in the new version. Hong Kong has been revised to Hong Kong, China in the new version.
Data Precision: The precision of float values may have changed from the original version. These changes reflect the most recent source data used for each indicator.
Regional Groupings: To preserve continuity with previous versions of this dataset, we have retained the column name 'cluster' instead of renaming it to 'six_regions'.
Fields
| Field | Type | Distribution | Summary | Missing |
|---|---|---|---|---|
yearYears from 1955 to 2005 at 5-year intervals | integer | 1,955 – 2,005 · mean 1,980 | Missing 0 | |
countryName of the country | string | 62 distinct | Afghanistan 11 · Argentina 11 · Australia 11 | Missing 0 |
clusterA categorical variable grouping countries by region | integer | 0 – 5 · mean 2.47 | Missing 0 | |
popPopulation of the country | integer | 82,660 – 1,305,000,000 · mean 57,620,000 | Missing 0 | |
life_expectLife expectancy in years | number | 27.79 – 82.5 · mean 66.98 | Missing 0 | |
fertilityFertility rate (average number of children per woman | number | 0.96 – 8.23 · mean 3.72 | Missing 0 |
Profiled across all 682 rows.
Explore
In Motion
Life expectancy against babies per woman for 62 countries, 1955 to 2005. Gapminder publishes a snapshot every five years; the bubbles glide between them using the easing functions new in Vega 6.4. Vega-Lite's own support for eased, interpolated animation is in review.
China is highlighted with its full path. Select any bubble to follow that country instead.
Preview
| year | country | cluster | pop | life_expect | fertility |
|---|---|---|---|---|---|
| 1955 | Afghanistan | 0 | 7971931 | 43.88 | 7.42 |
| 1960 | Afghanistan | 0 | 8622466 | 45.03 | 7.38 |
| 1965 | Afghanistan | 0 | 9565147 | 46.13 | 7.35 |
| 1970 | Afghanistan | 0 | 10752971 | 47.08 | 7.4 |
| 1975 | Afghanistan | 0 | 12157386 | 47.55 | 7.54 |
Scroll sideways for all 6 fields.
Examples
-
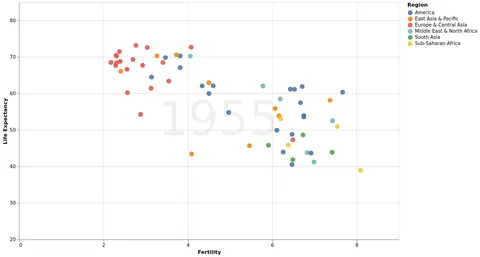 An interactive scatter plot of global health statistics by country and year. Open in Vega Editor
 -
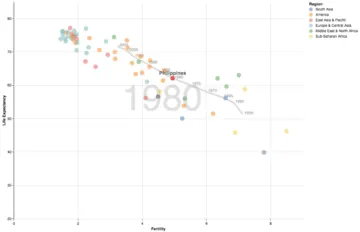 Global Development Open in Vega Editor
 -
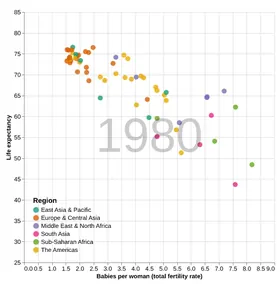 Scatter plot with point paths on hover and search box Python Source
Vega and Vega-Lite examples open in the Editor with this dataset loaded. Altair examples link to their Python source.
Provenance
- Source
-
- Gapminder Foundation - Life Expectancy (Data)
- Gapminder Foundation - Life Expectancy (Documentation)
- Gapminder Foundation - Population (Data)
- Gapminder Foundation - Population (Documentation)
- Gapminder Foundation - Fertility (Data)
- Gapminder Foundation - Fertility Documentation (Documentation)
- Gapminder Foundation - Data Geographies (Data)
- Gapminder Foundation - Data Geographies (Documentation)
- Gapminder Data Documentation
- License
-
- Creative Commons Attribution 4.0 International (CC-BY-4.0)
- File
data/gapminder.json· 75,201 bytes · View on GitHub