Create Figures for Papers
In this tutorial you will learn how to use Vega-Lite to create charts for figures and embed them in a paper written with LaTeX. The overall workflow includes (1) opening a chart in the online editor, (2) exporting a chart as SVG, (3) converting the SVG to PDF, (4) cropping the PDF to remove excessive whitespace, and (5) embedding a chart in a LaTeX paper.
Create a Chart in Vega-Lite
First, you need a chart. To export charts as figures, you can start with specifications from the online editor, use examples from the Vega-Lite website, copy charts created in Altair, or use charts from Observable. To export the chart, copy the Vega-Lite specification into the Vega-Lite editor.
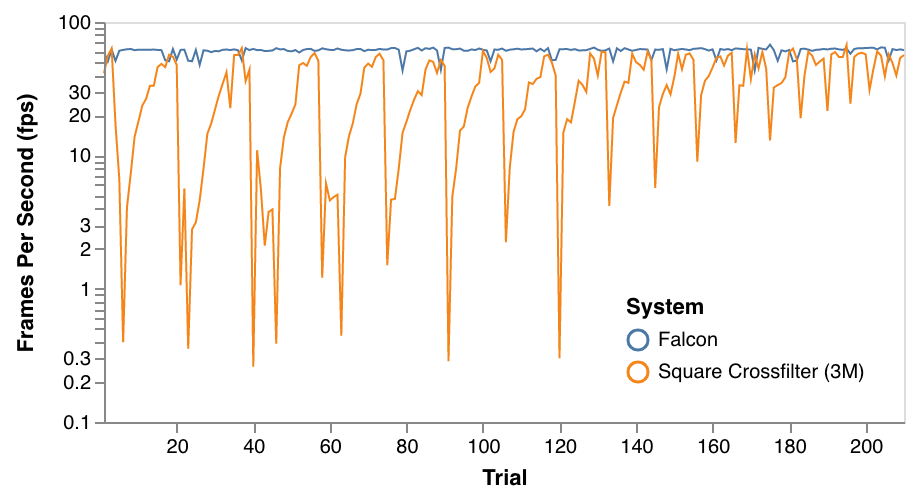
For this tutorial, we will use the example chart below, which you can view in the editor here. Note that the complete specification is stored in the URL. You can easily share modifications with your collaborators.
If you need to customize the figure beyond what is supported in Vega-Lite, you can open the compiled Vega in the editor, edit it as desired, and then continue the tutorial below.
Export as SVG
Now that you have loaded the chart in the editor, you can export it with “Export” and then “Open SVG”. We are exporting the chart as an SVG, a vector graphic format, which is infinitely scalable. You figure will be crisp even when zoomed in.
Print to PDF
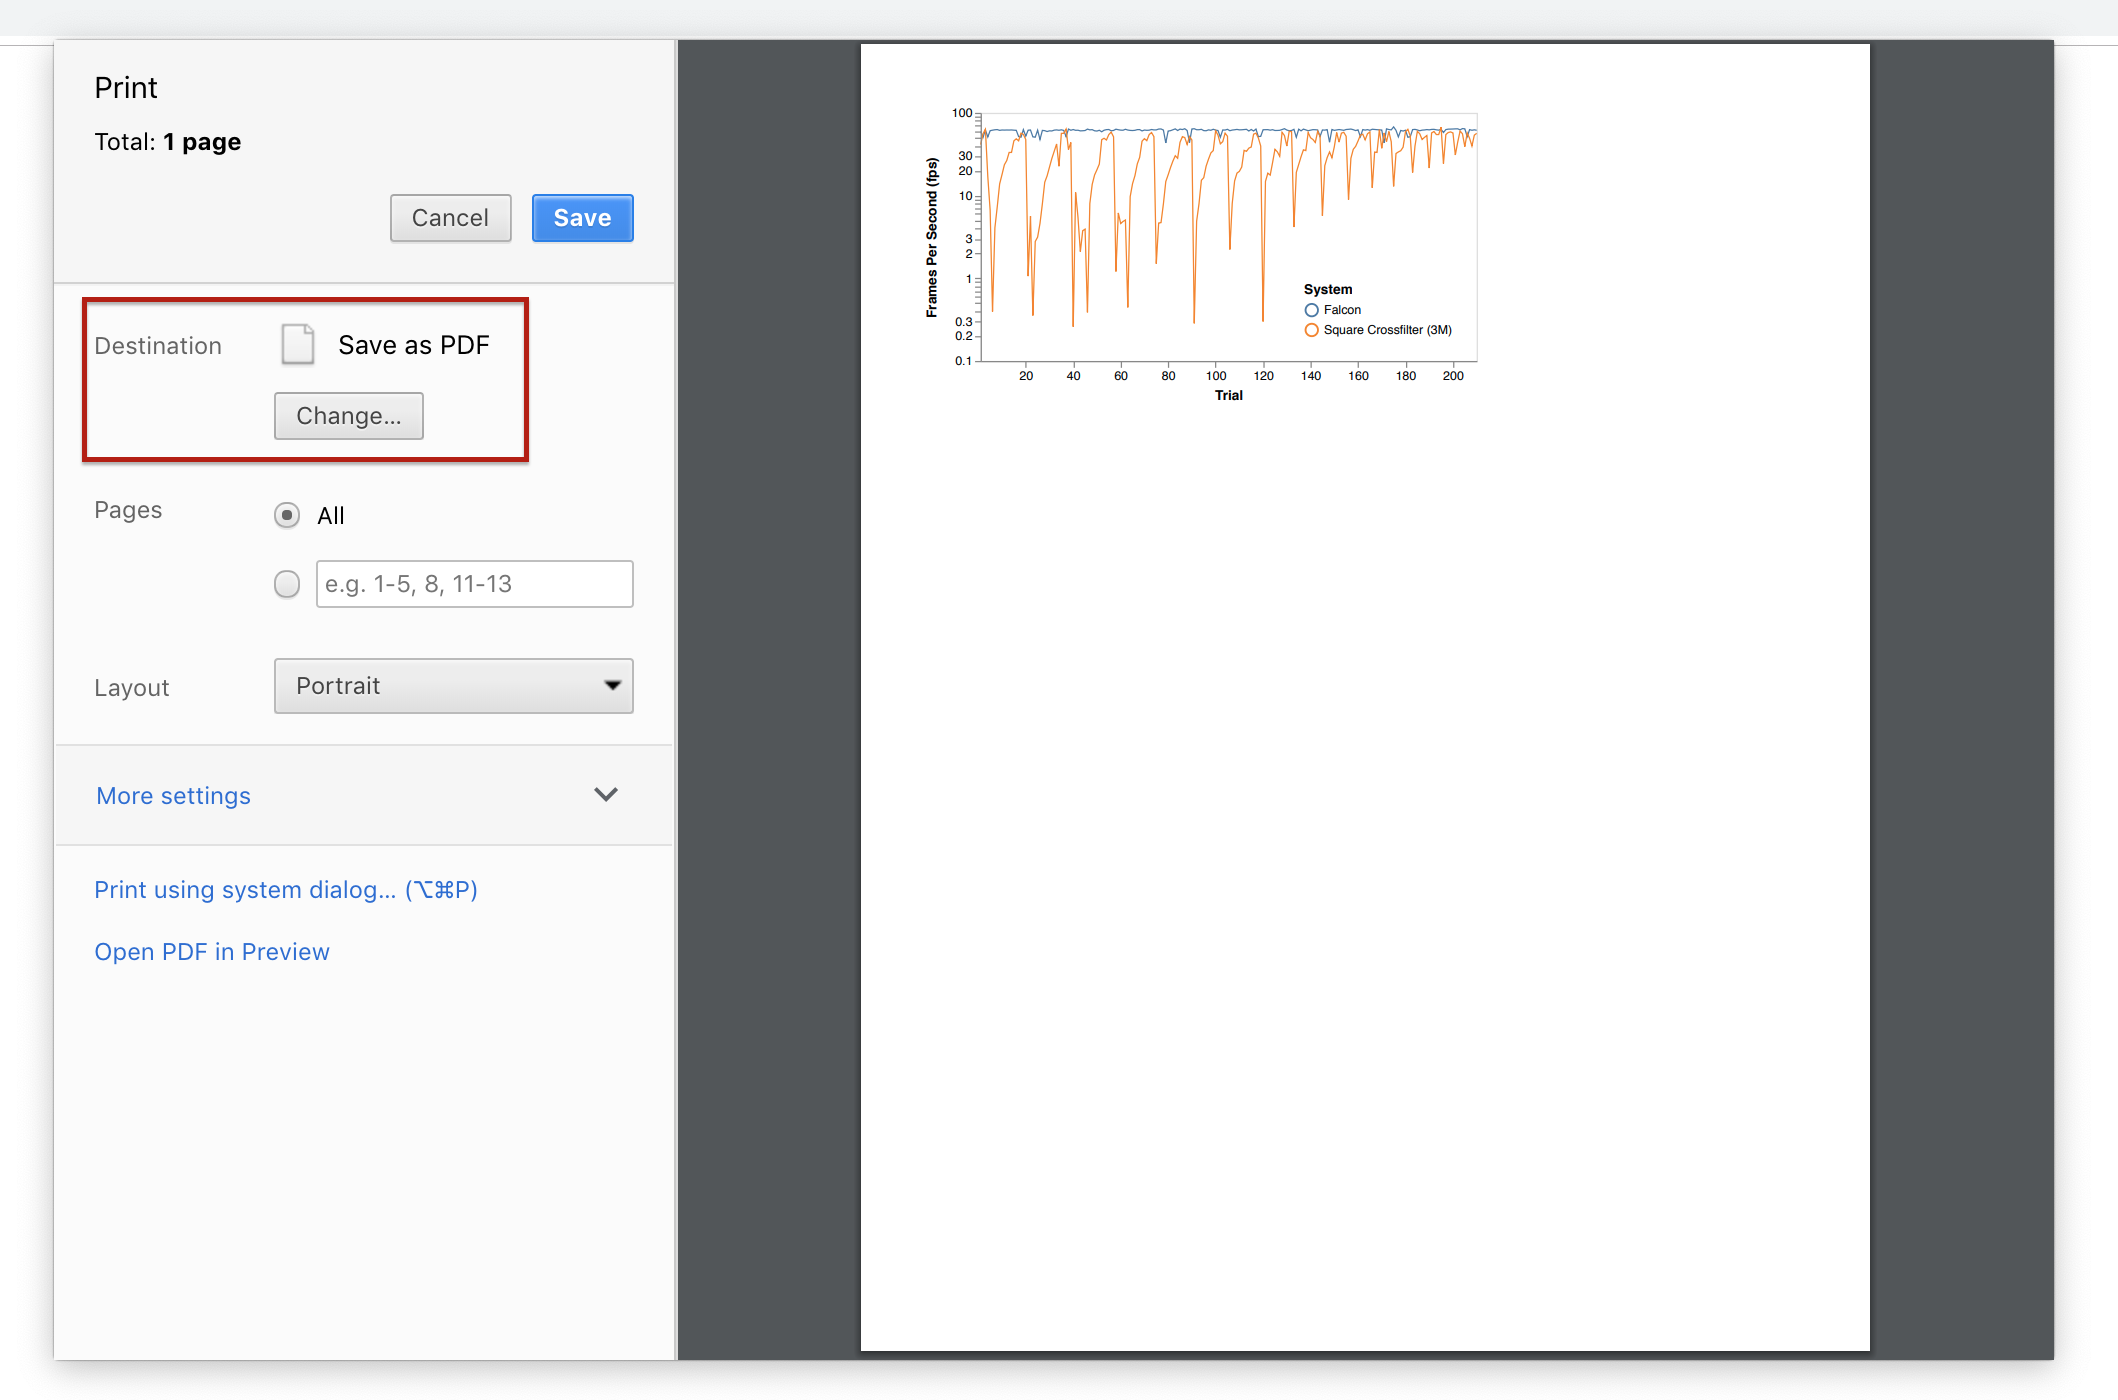
Unfortunately, LaTeX cannot import SVGs so we must first convert it to PDF. There are many ways to convert SVGs to PDF, including using illustrator, using another image editor, using command line scripts, or printing as PDF in the browser. For this tutorial, we are going to use the printing feature of your browser; from the newly opened SVG image, select “File” and then “Print…” (or use Cmd+P) in your browser (e.g. Chrome or Firefox).
Now make sure that the destination is set to “Save as PDF” (see below). Then save the PDF in the directory of your LaTeX paper.
Crop the PDF
You will notice that there is a lot of white space that we want to remove because the SVG image is saved as a single printer page. If your figure is too large, you need to scale it so that the output fits on a single page. To crop the file, open the PDF file in Mac OS Preview application. Select the “Rectangular Selection” tool and draw a box around the chart. You can adjust the box until it tightly fits the chart. Then click “crop” (or use Cmd+K). Make sure to save the newly modified file!
Embed the Chart
Lastly, embed the chart in the paper as a figure. In this case we named the PDF benchmark.pdf. Adjust the command below accordingly.
\begin{figure}
  \centering
  \includegraphics[width=\columnwidth]{benchmark}
  \caption{\label{fig:benchmark} A title that describes the figure.}
\end{figure}
That’s it. Do you have feedback on this tutorial or suggestions? Please create an issue on GitHub.