iowa_electricity
Iowa annual electricity generation by source
Annual net generation of electricity in Iowa by source, in thousand megawatthours. U.S. EIA data downloaded on May 6, 2018. Useful for illustrating stacked area charts. Demonstrates dramatic increase in wind power production.
CSV 51 rows 3 fields 1.5 KB 5 gallery examples 5 examples
Fields
| Field | Type | Distribution | Summary | Missing |
|---|---|---|---|---|
yearAdd a description for year | date | 2001 – 2017 | Missing 0 | |
sourceAdd a description for source | string | 3 distinct | Fossil Fuels 17 · Nuclear Energy 17 · Renewables 17 | Missing 0 |
net_generationAdd a description for net_generation | integer | 1,437 – 42,750 · mean 16,950 | Missing 0 |
Profiled across all 51 rows. No field descriptions yet. Add them
Explore
Vega-Lite · line mark · tooltipVega-Lite · line mark · tooltip
Open This Chart in the Vega Editor Preview
| year | source | net_generation |
|---|---|---|
| 2001-01-01 | Fossil Fuels | 35361 |
| 2002-01-01 | Fossil Fuels | 35991 |
| 2003-01-01 | Fossil Fuels | 36234 |
| 2004-01-01 | Fossil Fuels | 36205 |
| 2005-01-01 | Fossil Fuels | 36883 |
Examples
-
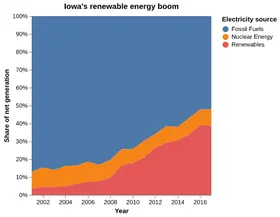 Iowa's Renewable Energy Boom Python Source
 -
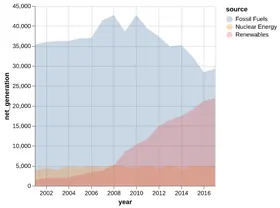 Layered Area Chart Python Source
 -
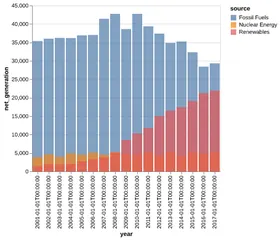 Layered Bar Chart Python Source
 -
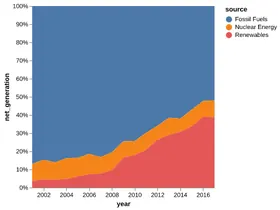 Normalized Stacked Area Chart Python Source
 -
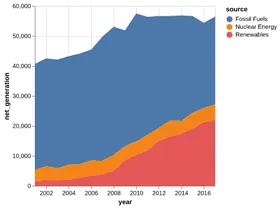 Simple Stacked Area Chart Python Source
Vega and Vega-Lite examples open in the Editor with this dataset loaded. Altair examples link to their Python source.
Provenance
- Source
- License
-
- U.S. Government Dataset (other-pd)
- File
data/iowa-electricity.csv· 1,531 bytes · View on GitHub