github
Simulated hourly GitHub commit counts
Simulated GitHub contribution data showing hourly commit counts across different times of day. Designed to demonstrate typical patterns of developer activity in a GitHub-style punchcard visualization format.
CSV 955 rows 2 fields 21 KB 2 gallery examples 2 examples
Fields
| Field | Type | Distribution | Summary | Missing |
|---|---|---|---|---|
timeHourly timestamp from January 1st to May 30th, 2015 | string | 955 distinct | 2015/01/01 01:00:00 1 · 2015/01/01 04:00:00 1 · 2015/01/01 05:00:00 1 | Missing 0 |
countSimulated hourly commit counts | integer | 1 – 54 · mean 2.6 | Missing 0 |
Profiled across all 955 rows.
Explore
Vega-Lite · bar mark · count aggregate · binning · tooltipVega-Lite · bar mark · count aggregate · binning · tooltip
Open This Chart in the Vega Editor Preview
| time | count |
|---|---|
| 2015/01/01 01:00:00 | 2 |
| 2015/01/01 04:00:00 | 3 |
| 2015/01/01 05:00:00 | 1 |
| 2015/01/01 08:00:00 | 1 |
| 2015/01/01 09:00:00 | 3 |
Examples
-
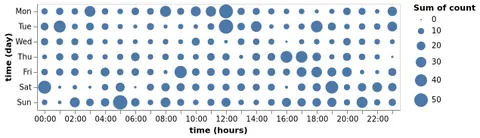 Table Bubble Plot (Github Punch Card) Open in Vega Editor
 -
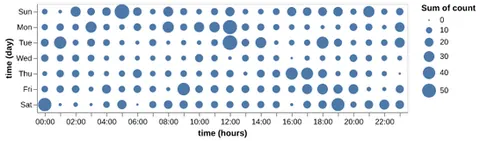 Table Bubble Plot (Github Punch Card) Python Source
Vega and Vega-Lite examples open in the Editor with this dataset loaded. Altair examples link to their Python source.
Provenance
- Source
- License
- File
data/github.csv· 21,059 bytes · View on GitHub