flights_2k
U.S. flight delays and routes (2,000 flights)
Flight delay statistics (2,000 rows) from U.S. Bureau of Transportation Statistics.
Collected under regulatory reporting requirements (14 CFR Part 234), which mandate
that qualifying airlines report on-time performance data to BTS. Transformed using
/scripts/flights.py
JSON 2,000 rows 5 fields 178 KB 3 gallery examples 3 examples
Fields
| Field | Type | Distribution | Summary | Missing |
|---|---|---|---|---|
dateAdd a description for date | datetime%Y/%m/%d %H:%M | Jan 1, 2001, 06:55 AM – Mar 31, 2001, 09:42 PM | Missing 0 | |
delayAdd a description for delay | integer | -52 – 365 · mean 6.78 | Missing 0 | |
distanceAdd a description for distance | integer | 67 – 4,130 · mean 736.7 | Missing 0 | |
originAdd a description for origin | string | 155 distinct | ORD 119 · DFW 102 · LAX 83 | Missing 0 |
destinationAdd a description for destination | string | 153 distinct | ORD 139 · DFW 116 · ATL 75 | Missing 0 |
Profiled across all 2,000 rows. No field descriptions yet. Add them
Explore
Pick two fields. Scroll to zoom, drag to pan. Both fields have values in 2,000 of 2,000 rows.Pick two fields. Both fields have values in 2,000 of 2,000 rows. Vega-Lite · input binding · scale bindingVega-Lite · input binding
Open This Chart in the Vega Editor Preview
| date | delay | distance | origin | destination |
|---|---|---|---|---|
| 2001/01/01 06:55 | -19 | 1797 | LAX | BNA |
| 2001/01/01 08:47 | 0 | 1609 | SJC | IAH |
| 2001/01/01 09:24 | -4 | 1117 | IAH | PIT |
| 2001/01/01 10:18 | -3 | 102 | HNL | LIH |
| 2001/01/01 11:45 | 20 | 920 | MIA | DCA |
Scroll sideways for all 5 fields.
Examples
-
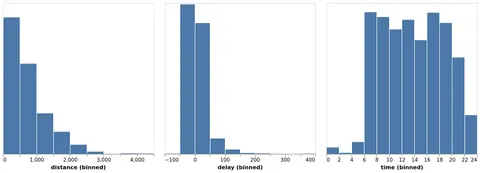 Crossfilter (Filter) Open in Vega Editor
 -
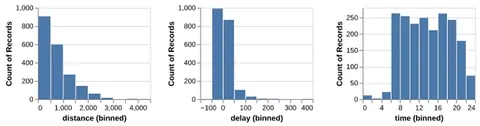 Interactive Crossfilter Python Source
 -
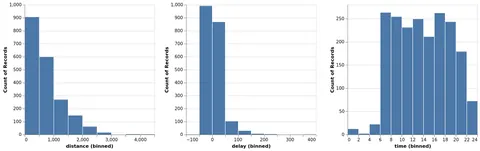 Crossfilter (Highlight) Open in Vega Editor
Vega and Vega-Lite examples open in the Editor with this dataset loaded. Altair examples link to their Python source.
Provenance
- Source
- License
- File
data/flights-2k.json· 178,495 bytes · View on GitHub