co2_concentration
Monthly atmospheric CO2 at Mauna Loa
Atmospheric CO2 concentration measurements from Mauna Loa Observatory, Hawaii. Contains monthly readings from 1958-2020 with two key measurements:
- CO2 concentrations in millionths of a mole of CO2 per mole of air (parts per million), reported on the 2012 SIO manometric mole fraction scale
- Seasonally adjusted values where a 4-harmonic fit with linear gain factor has been subtracted to remove the quasi-regular seasonal cycle Values are adjusted to 24:00 hours on the 15th of each month. Only includes rows with valid data.
CSV 741 rows 3 fields 19 KB 2 gallery examples 2 examples
Fields
| Field | Type | Distribution | Summary | Missing |
|---|---|---|---|---|
DateAdd a description for Date | date | Mar 1, 1958 – Apr 1, 2020 | Missing 0 | |
CO2Add a description for CO2 | number | 313.2 – 416.2 · mean 355.3 | Missing 0 | |
adjusted CO2Add a description for adjusted CO2 | number | 314.4 – 413.4 · mean 355.3 | Missing 0 |
Profiled across all 741 rows. No field descriptions yet. Add them
Explore
Pick two fields. Scroll to zoom, drag to pan. Both fields have values in 741 of 741 rows.Pick two fields. Both fields have values in 741 of 741 rows. Vega-Lite · input binding · scale bindingVega-Lite · input binding
Open This Chart in the Vega Editor Preview
| Date | CO2 | adjusted CO2 |
|---|---|---|
| 1958-03-01 | 315.70 | 314.44 |
| 1958-04-01 | 317.46 | 315.16 |
| 1958-05-01 | 317.51 | 314.71 |
| 1958-07-01 | 315.86 | 315.19 |
| 1958-08-01 | 314.93 | 316.19 |
Examples
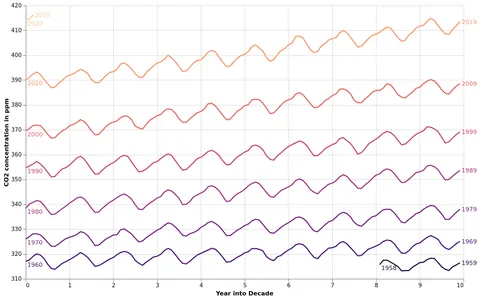
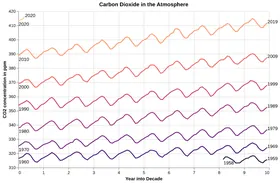
Vega and Vega-Lite examples open in the Editor with this dataset loaded. Altair examples link to their Python source.
Provenance
- Source
- License
-
- Creative Commons Attribution 4.0 (CC-BY-4.0)
- File
data/co2-concentration.csv· 18,547 bytes · View on GitHub